
Everything You Need to Know About Average PSAT Score in 2026

On this page
- What Is the Average PSAT Score in 2026? The Direct Answer
- PSAT Score Benchmarks by Grade: 10th and 11th Graders Compared
- What Counts as a Good PSAT Score at Each Grade Level
- Is Your PSAT Score Below Average? Here Is What It Actually Means
- Average PSAT Score for National Merit: What the Cutoffs Actually Require
- How Your PSAT Score Translates to an SAT Projection
- How to Use Your PSAT Score as a Starting Point for SAT Prep
- FAQ
- Is a 900 PSAT score bad?
- Is 1000 an okay PSAT score?
- What PSAT score do you need for National Merit?
- Is a 700 PSAT score bad?
- What is the average PSAT score for a junior in high school?
- Does a PSAT score affect college admissions?
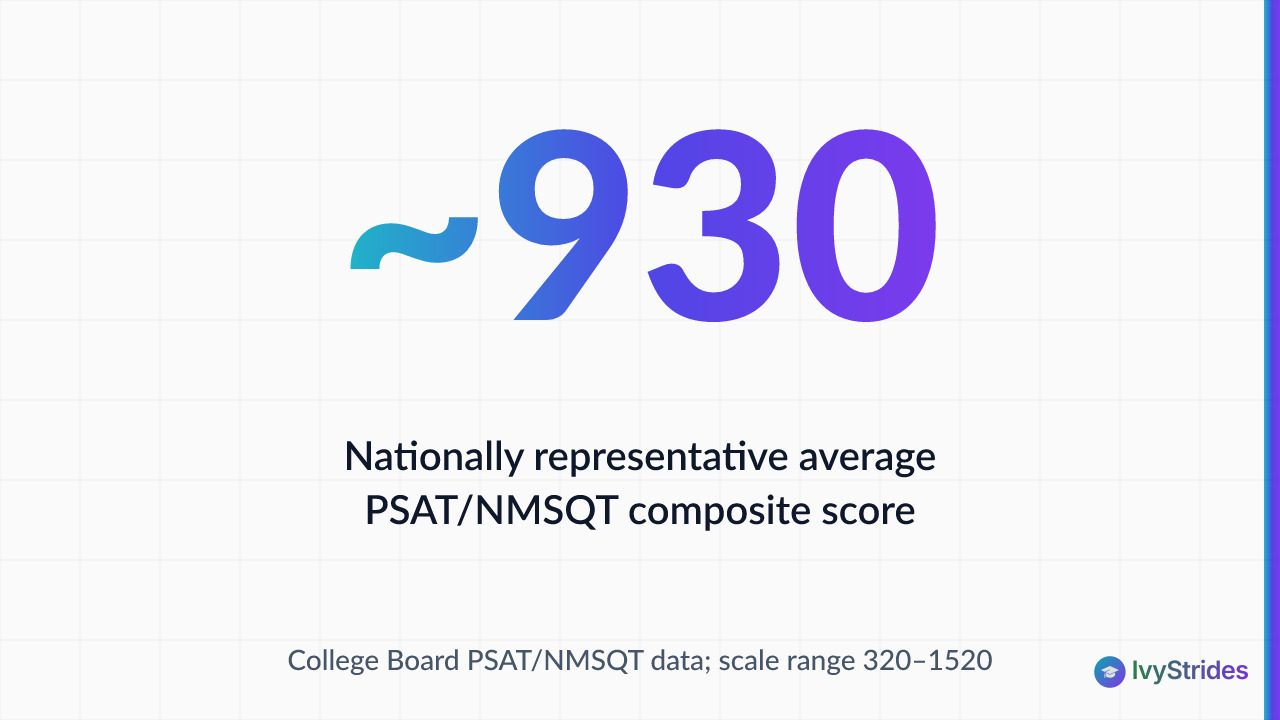
The national average PSAT/NMSQT score is about 930 out of 1520, split roughly 470 in Reading and Writing and 460 in Math. Averages shift by grade: 10th graders average around 890, while 11th graders average around 980. A composite of 1210 or higher places a student in roughly the top 10 percent of test takers. For National Merit Semifinalist consideration, most states require a Selection Index of 207 or higher for the Class of 2027, which corresponds to a composite in the 1400 to 1520 range.
Those figures come from College Board PSAT/NMSQT score reports, and the National Merit thresholds shift year to year and state to state. The next sections break the averages down by grade, translate raw scores into percentile rank, walk through what qualifies for the National Merit Scholarship Program, and give you a concrete next step once you know where your score sits.
What Is the Average PSAT Score in 2026? The Direct Answer
Here are the numbers you came for.
The PSAT/NMSQT has a composite score range of 320 to 1520, reported in 10-point increments. It has two sections: Reading and Writing, scored 160 to 760, and Math, scored 160 to 760. Per College Board PSAT/NMSQT score data, the nationally representative sample average composite is roughly 930. The midpoint of the 320-1520 scale is 920, which sits right next to that observed average, a useful coincidence to remember.
Section-level averages break down like this:
- Reading and Writing section average: roughly 470
- Math section average: roughly 460
Grade-level averages diverge meaningfully. 10th graders average around 890 composite. 11th graders average around 980. That roughly 90-point gap reflects an extra year of high school English, algebra, and, for many students, some geometry and data-analysis exposure. It also reflects the fact that many juniors have started informal SAT preparation by fall of 11th grade.
Since 2023-2024, the PSAT/NMSQT has used an adaptive digital format. Both the Reading and Writing section and the Math section split into two modules; performance on Module 1 sets the difficulty of Module 2. That structure matters when we get to score projection later. For a fuller breakdown of every score band from 320 to 1520 and the percentile each represents, see our companion guide on PSAT score range and percentiles.
PSAT Score Benchmarks by Grade: 10th and 11th Graders Compared
A 1000 doesn't mean the same thing for a sophomore that it means for a junior. Grade context is everything.
Here's how the score bands stack up.
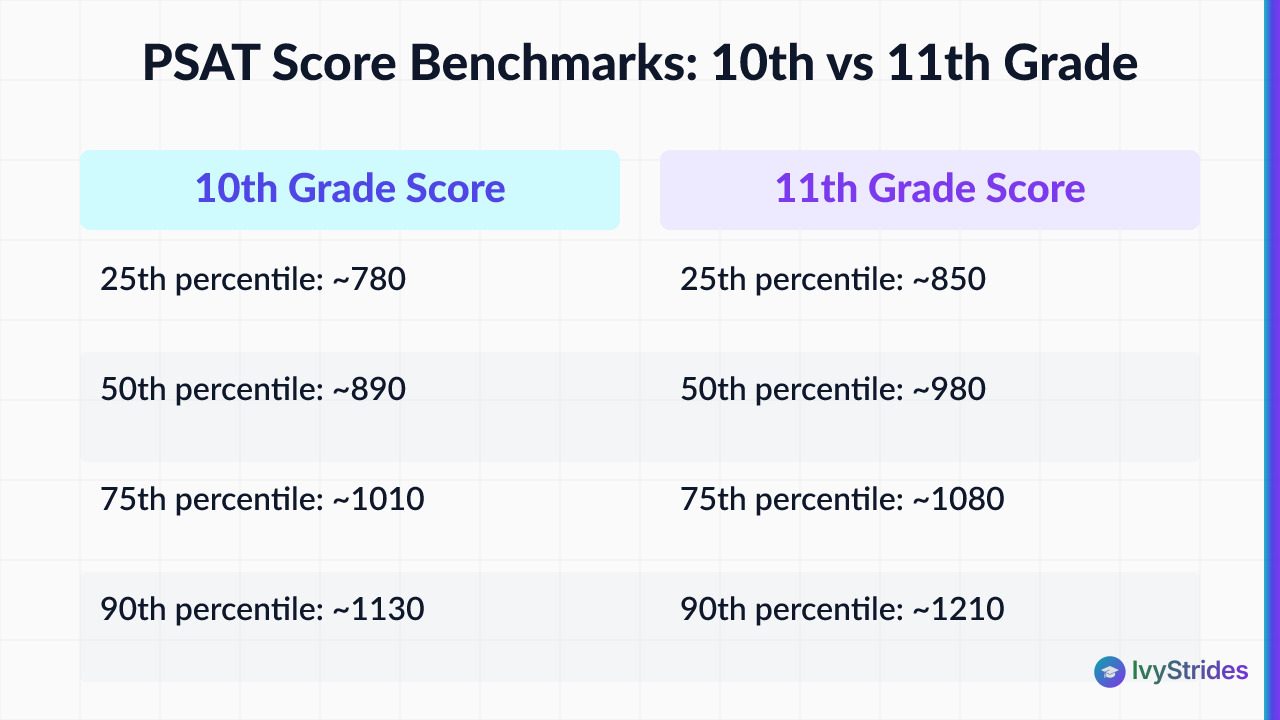
10th grade percentile benchmarks (PSAT 10 and 10th-grade PSAT/NMSQT takers):
- 25th percentile: roughly 780
- 50th percentile: roughly 890
- 75th percentile: roughly 1010
- 90th percentile: roughly 1130
- 99th percentile: roughly 1390
11th grade percentile benchmarks (PSAT/NMSQT):
- 25th percentile: roughly 850
- 50th percentile: roughly 980
- 75th percentile: roughly 1080
- 90th percentile: roughly 1210
- 99th percentile: roughly 1420
Read across the same rows and the pattern is clear. A sophomore scoring 1200 sits above the 90th percentile for their grade. A junior scoring 1270 lands in roughly the top 10 percent of all 11th-grade test takers nationally. A 1000 places a sophomore in the top third of their grade, but puts a junior at approximately the 48th to 50th percentile, slightly below the 11th-grade average.
One clarification on 9th graders. The PSAT 8/9, taken by 8th and 9th graders, uses a different score scale (240 to 1440) and is a distinct exam from the PSAT/NMSQT. Averages from the PSAT 8/9 aren't directly comparable to the numbers above, so if you have a 9th grader, don't use PSAT/NMSQT tables to interpret their score.
For a deeper look at what these numbers mean for a sophomore specifically, see our guide to good PSAT scores for 10th graders. If you want the framework across both grade levels, our overview of what is a good PSAT score walks through the same benchmarks with more section-level detail.
What Counts as a Good PSAT Score at Each Grade Level
"Good" is a percentile question, not an absolute-number question. That's the single most useful reframe in this whole article.
A score is good when it sits comfortably above the average for the student's grade and points toward a strong SAT baseline. Here's how the common score benchmarks read at each grade level.
A 900 composite. For a 10th grader, this sits near the 50th percentile (average is roughly 890). Not a warning sign; a solid starting point with two years of runway before senior-year SAT dates. For an 11th grader, 900 falls below the 50th percentile (average is roughly 980). Not disqualifying, but it does signal that focused SAT prep is needed before the spring of junior year.
A 1000 composite. For a sophomore, 1000 is above the grade-level average and lands in roughly the 60th to 65th percentile. Solid. For a junior, 1000 is slightly below the grade-level average, approximately the 48th to 50th percentile. Workable, but well short of the 1210 to 1270 range that defines the top 10 percent, and far short of the 1400-plus territory needed for National Merit Semifinalist consideration.
A 1200 composite. Strong at either grade level. For a sophomore, 1200 places the student above the 90th percentile for their grade. For a junior, 1200 sits at roughly the 88th to 90th percentile, right at the edge of the top 10 percent.
A 1270 or higher. This is the commonly cited "top 10 percent" threshold for 11th graders and the score band where National Merit conversations start to become realistic (though far from guaranteed, as the next section explains). For a related score-band read, see our take on whether 1280 is a good PSAT score.
One caveat worth stating clearly. PSAT scores aren't submitted to colleges. Their admissions impact is limited to the National Merit pathway, which is covered below. Test-optional policies apply to SAT and ACT scores, not PSAT, so a below-average PSAT doesn't affect a student's ability to apply test-optional to a given school. FairTest maintains a running list of test-optional colleges if you want to check specific schools.
Is Your PSAT Score Below Average? Here Is What It Actually Means

Photo by Andy Barbour on Pexels
If your composite is under 850 as a junior or under 780 as a sophomore, you're below the 25th percentile for your grade. That's real information, and it's more useful than most students realize.
Here's what specific low-band scores translate to in percentile terms for 11th graders.
- A 700 composite: roughly the 5th to 8th percentile. Indicates substantial gaps across both Reading and Writing and Math.
- A 750 composite: roughly the 12th percentile.
- An 850 composite: roughly the 25th percentile, the standard "below-average" threshold.
A below-average PSAT is most useful as a diagnostic. It tells you which section carries the larger gap, which sub-scores are dragging the composite, and which question types you missed most often. That information is the foundation of a targeted prep plan.
In our coaching, students whose PSAT Math score is 60 or more points below their Reading and Writing score almost always have a specific algebra or data-analysis gap, not a general math weakness. Diagnosing that gap precisely is what separates a productive 12-week prep cycle from a frustrating one.
Also in our coaching, students starting in the 750 to 850 PSAT range who complete a full diagnostic-driven SAT prep program typically see meaningful SAT score improvement over roughly 12 to 16 weeks. Not guaranteed, and it depends on hours invested and consistency. The starting move is a full-length practice test to establish a real baseline. Our PSAT practice tests library gives you the format-accurate starting point. If you want a curated shortlist of what to prioritize, our roundup of the best PSAT practice tests walks through the options.
Average PSAT Score for National Merit: What the Cutoffs Actually Require
The National Merit Scholarship Program doesn't use the composite score directly. It uses the Selection Index.
Selection Index = (Reading and Writing score + Math score) × 2. The maximum possible Selection Index is 1520.
Here's how the thresholds work for the Class of 2027 (juniors who took the October 2025 PSAT/NMSQT):
- Commended Student level: Selection Index of 208. This is a national threshold, the same for every state.
- Semifinalist cutoffs: vary by state, typically in the 207 to 222 range. Lower-competition states may set cutoffs around 207 to 210. Higher-competition states, such as New Jersey, Massachusetts, and California, may set cutoffs around 218 to 222.
In composite score terms, most Semifinalists score between 1400 and 1520. A student with a Selection Index of 1400 clears Commended nationally. Whether that student clears their state's Semifinalist cutoff depends on the state. The math on Selection Index is section-based, not composite-based, so two students with the same composite can have different Selection Indices depending on their section split.
Perfect 1520 composites are achieved by a very small number of students nationally each year. Top 1 percent for 11th graders sits at roughly 1420 to 1520.
Two hard caveats before you plan around these numbers. First, National Merit cutoffs shift year to year. Always verify against the current official announcement from the National Merit Scholarship Corporation before you plan around a specific target. Second, being a Semifinalist doesn't guarantee Finalist status; students must also submit a strong Finalist application, including a confirming SAT score.
If you're trying to figure out whether your junior-year PSAT sets you up for a competitive SAT sitting, our read on whether your PSAT results are good enough for SAT success is the right next stop.
How Your PSAT Score Translates to an SAT Projection
Because the PSAT and SAT share the same scoring scale and adaptive structure, your PSAT score is a reliable early signal of where your SAT score would land today.
Both exams score 320 to 1520 with section scores of 160 to 760. The PSAT is designed to be slightly less difficult than the SAT, but the difference is smaller than most students expect. In our coaching, students typically score roughly 20 to 80 points higher on the SAT than on the PSAT after equivalent preparation, though the gap depends heavily on the section split and the specific weaknesses that go unaddressed between the two tests.
A rough example. A junior scoring 980 on the October PSAT/NMSQT projects to roughly a 1000 to 1060 SAT baseline before any dedicated prep. That baseline is the starting point, not the ceiling. The more informative number is the section split. If Math is 80 points below Reading and Writing on the PSAT, that gap is where SAT prep hours should concentrate first.
Recommended timeline: begin SAT prep roughly three to four months after receiving October PSAT scores. That gives you time for a full diagnostic cycle, targeted work on the weaker section, and a spaced retest before spring SAT dates. Students who start SAT prep within about four to six weeks of receiving their PSAT scores typically have the clearest diagnostic baseline to work from.
Two related reads if you want the deeper comparison: is the PSAT harder than the SAT and the full difference between SAT and PSAT breakdown.
How to Use Your PSAT Score as a Starting Point for SAT Prep
Here's the three-step framework we use with new students.
Step 1: Take a full-length official SAT practice test within about two to three weeks of receiving PSAT scores. The PSAT gives you a starting signal, but the SAT is the test that actually matters for admissions. Establishing a true SAT baseline early prevents you from prepping for the wrong difficulty level. Format-accurate practice materials matter here; a practice test that doesn't mirror the adaptive digital structure will give you a misleading number.
Step 2: Identify the section with the larger gap and allocate roughly 60 to 70 percent of your prep hours there. This is where section-specialist coaching matters. A student whose PSAT Math score is 380 and R&W is 520 doesn't need a generalist tutor; they need a Math specialist who can diagnose whether the gap is algebra fundamentals, problem-solving fluency, or data-analysis interpretation. Our PSAT 1-on-1 prep service is built around this section-specialist model.
Step 3: Retest every roughly four to six weeks with a fresh full-length practice test. Spaced retesting measures whether your prep is actually moving the needle, and it lets you adjust the plan before you invest weeks in a strategy that isn't working. Reviewing mistakes properly is where most of the improvement compounds; our guide on how to review your SAT practice test mistakes walks through the review protocol we teach.
In our coaching with students starting from a PSAT score in the 900 to 1050 range, those who complete a full diagnostic-driven program typically see SAT score improvements over roughly 12 to 16 weeks. Outcomes depend on hours invested, consistency of practice, and starting score band. No score improvement is guaranteed.
If you want to self-start with structured materials, our free downloads library is a good entry point.
FAQ
Is a 900 PSAT score bad?
A 900 is near the national average for 10th graders (roughly 890) and slightly below the average for 11th graders (roughly 980). For a sophomore, it's a reasonable starting point with two years of runway. For a junior, it signals a meaningful gap to close before spring SAT dates, but it isn't a disqualifying score. The more useful question is which section is dragging the composite down, because that tells you exactly where to focus prep hours.
Is 1000 an okay PSAT score?
Yes. A 1000 is above the national average for 10th graders and roughly at the 50th percentile for 11th graders. It's a solid baseline but falls well short of the 1210 to 1270 range needed for the top 10 percent, and far short of the 1400-plus range needed for National Merit consideration. For most students, a 1000 PSAT is a workable starting point for SAT prep with a realistic target of roughly 1150 to 1250 on the SAT after a structured prep program.
What PSAT score do you need for National Merit?
National Merit eligibility is based on the Selection Index, which equals your Reading and Writing score plus your Math score, multiplied by two. The Commended Student threshold for the Class of 2027 is a Selection Index of 208. Semifinalist cutoffs vary by state, ranging from roughly 207 in lower-competition states to about 222 in higher-competition states such as New Jersey, Massachusetts, and California. In composite score terms, most Semifinalists score between 1400 and 1520. Always verify the current year's cutoffs through official National Merit Scholarship Corporation announcements, since cutoffs shift annually.
Is a 700 PSAT score bad?
A 700 composite falls significantly below the 25th percentile for both 10th and 11th graders and places a student in roughly the 5th to 8th percentile range. It indicates substantial gaps in both Reading and Writing and Math. That said, it's most useful as a diagnostic signal. Students in this score band benefit most from a full diagnostic test followed by a structured, section-by-section improvement plan rather than general test-taking tips.
What is the average PSAT score for a junior in high school?
The average PSAT/NMSQT score for 11th graders is roughly 980 out of 1520, split approximately 500 in Reading and Writing and 480 in Math. A junior scoring at or above 1080 is in the top 25 percent of their grade-level peers. A score of 1210 or higher places a junior in roughly the top 10 percent nationally.
Does a PSAT score affect college admissions?
PSAT scores aren't submitted to colleges and don't directly affect admissions decisions. Their admissions relevance is limited to the National Merit Scholarship pathway: Semifinalists and Finalists can list that recognition on college applications, which carries weight at many selective schools. Test-optional admissions policies apply to SAT and ACT scores, not PSAT. The primary value of the PSAT for most students is as a diagnostic baseline for SAT preparation.
Your PSAT score is a starting signal, not a verdict. What matters next is what you do with the diagnostic information it hands you.

Award-winning author (South Asian Book Award) and graduate of BITS Pilani and UCLA Luskin School of Public Affairs. Brings a published writer's eye to Common App essays and grammatical precision to SAT and ACT R&W instruction.