
PSAT Score Range and Percentiles: The Complete 2026 Guide for Students and Parents

On this page
- PSAT Score Range at a Glance: What the Numbers Actually Mean
- PSAT Percentile Tables for 10th and 11th Grade (2026)
- My Score Came Back and I Have No Idea If It Is Good: Interpreting Your Report
- Not Sure What Your PSAT Score Means for Your SAT Plan?
- What Counts as a Good PSAT Score by Grade Level
- PSAT Scores and the National Merit Scholarship Pathway
- How Your PSAT Score Predicts SAT Readiness
- Understanding Your PSAT Score Report
- Next Steps Based on Your Score Band
- FAQ
- What PSAT score puts a student in the top 1 percent?
- Is a 980 a weak PSAT score?
- Is a 740 Math section score on the PSAT considered strong?
- Is a 1200 a good score on the PSAT 10?
- Does a 1470 PSAT score automatically qualify a student for National Merit?
- What is a good PSAT score for a freshman or 9th grader?
- How does a PSAT score in California compare to the national benchmark?
- Ready to Turn Your PSAT Score Into an SAT Plan?
The PSAT/NMSQT and PSAT 10 total score range is 320 to 1520, split across two sections (Reading and Writing, Math) scored 160 to 760 each. For 11th graders, the 50th percentile sits around 980, the 75th around 1150, the 90th around 1350, and the 99th begins near 1370. For 10th graders, the same benchmarks land at roughly 920, 1050, 1200, and 1420. PSAT 8/9, taken earlier, uses a different 240 to 1440 scale and doesn't qualify for National Merit.
These percentile figures come from the College Board's PSAT/NMSQT understanding-scores report, refreshed each year. The distinction most families miss on first read is that College Board reports two different percentiles for every score, and National Merit uses a separate calculation entirely. The rest of this guide walks through both, plus what to do with the score you have.
PSAT Score Range at a Glance: What the Numbers Actually Mean
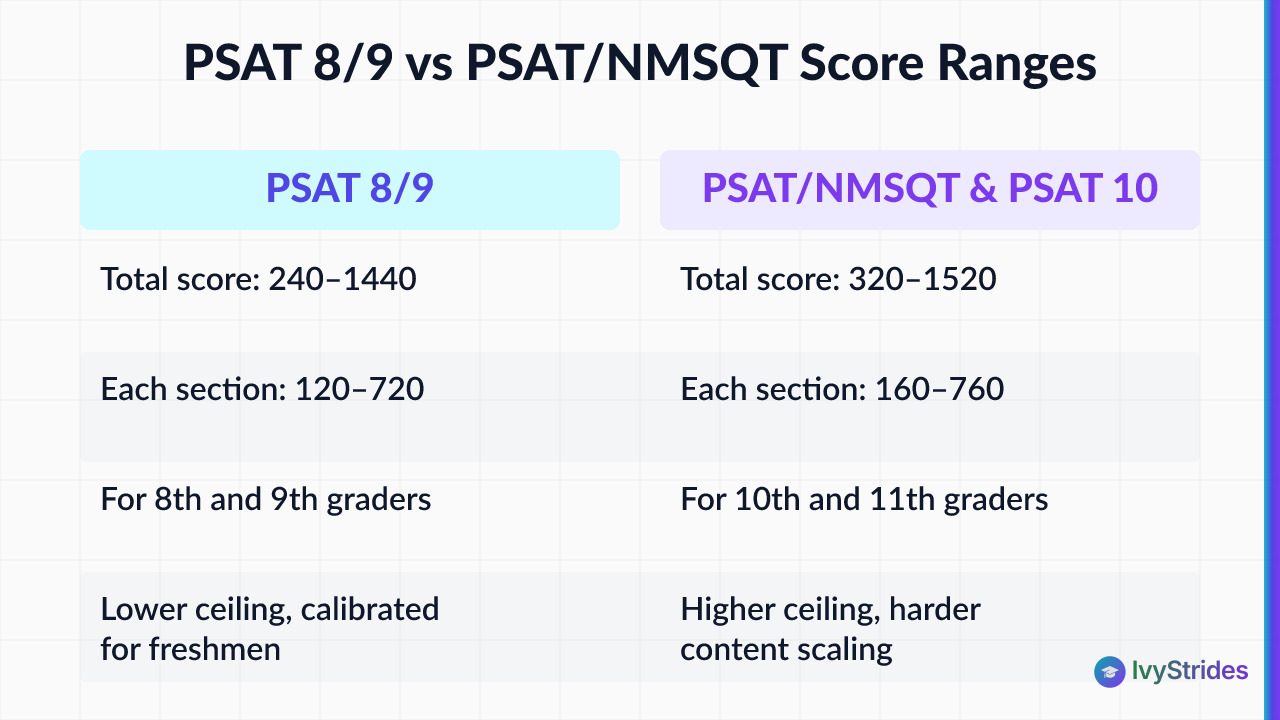
Three tests share the PSAT name, and they don't share a scale.
The PSAT/NMSQT, administered every October to sophomores and juniors, and the PSAT 10, administered to 10th graders in the spring, both use a total score range of 320 to 1520. Two sections contribute equally: Reading and Writing scored 160 to 760, and Math scored 160 to 760. Your total score is the sum. A perfect score is 1520. The floor is 320, not zero, because the scale places a student's ability relative to the College Board framework rather than counting raw correct answers.
The PSAT 8/9, given to 8th and 9th graders, uses a lower scale of 240 to 1440. Each section runs 120 to 720. This lower ceiling matters. A 1200 on the PSAT 8/9 is a strong result for a freshman but doesn't translate one-to-one into a 1200 on the PSAT/NMSQT the following year, because the underlying content difficulty and scaling are calibrated differently. For a fuller comparison of the SAT and PSAT scoring families, see our breakdown of the difference between SAT and PSAT.
All three tests are now digital and adaptive. Each section is delivered in two modules, and performance on the first module determines the difficulty of the second. Your section score reflects both accuracy and the difficulty band you unlocked.
PSAT Percentile Tables for 10th and 11th Grade (2026)
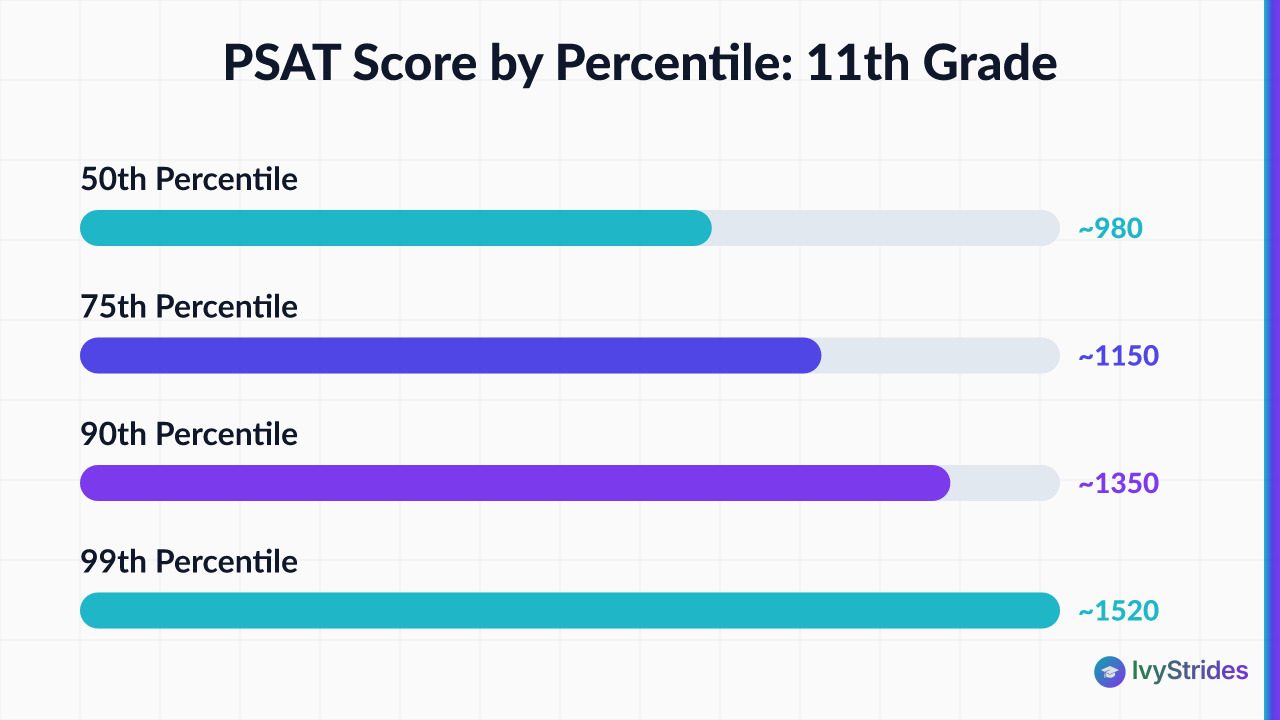
Percentiles are where most parents start. They're also where most first-time readers get confused, because College Board reports two of them.
User percentile compares your student to other students in the same grade who actually took the PSAT. Nationally representative percentile compares your student to a projected sample of all students in that grade, including students who didn't take the test. Because the pool of actual PSAT takers skews academically motivated, the user percentile is almost always lower than the nationally representative percentile for the same score. For benchmarking against SAT competition and National Merit context, user percentile is the number that matters.
Here is the approximate 2026 user-percentile mapping, drawn from the College Board PSAT/NMSQT percentile report:
| Percentile | 10th Grade Total | 11th Grade Total |
| 50th | ~920 | ~980 |
| 75th | ~1050 | ~1150 |
| 90th | ~1200 | ~1350 |
| 99th | 1420–1520 | ~1370–1520 |
The same score means different things by grade. A 1100 is roughly the 81st percentile for a 10th grader and roughly the 66th percentile for an 11th grader. That single fact reframes half the anxious questions we hear. A sophomore scoring 1100 is well above the national middle. A junior at 1100 is above average but has a real gap to close if the target SAT is 1350 or higher.
Section-level percentiles matter too, and they aren't symmetric. At the 99th percentile, section scores land around 700 in Reading and Writing and around 740 in Math. Math tends to have a steeper top end because a small number of missed questions drops you further. For grade-specific context for a sophomore, our full write-up on good PSAT scores for 10th graders drills into the 10th-grade table with more granularity. Students who want a second diagnostic before drawing conclusions can work through our library of PSAT practice tests.
My Score Came Back and I Have No Idea If It Is Good: Interpreting Your Report
Here's the part most students miss when they open the report for the first time. A 980 in 11th grade isn't a warning sign. It's the middle. Half of tested juniors scored at or below that number. But it isn't a signal to relax either. If the family target is a 1300+ SAT, a 980 PSAT means the runway is 300+ points, and that runway needs a plan.
The score report shows more than the total. It shows two section scores, subscores within each section (Command of Evidence, Expression of Ideas, Algebra, Advanced Math, Problem Solving and Data Analysis), and two percentile columns. Read the section split before the total. A student with 520 R&W and 460 Math has a Math-first priority. A student with 460 R&W and 540 Math has the opposite priority. Studying both sections equally is the single most common mistake we see families make after a PSAT release.
In our coaching, students who identify the weaker section from the PSAT report and address it first tend to see the largest score gains on their first SAT attempt. The reverse is also true. Students who read only the total score and pick a generic prep book usually make progress on the section they were already stronger in, and leave the weak section untouched. Look at the subscore data too. If Algebra is 12 out of 15 correct but Advanced Math is 5 out of 12, you know exactly where the next four weeks of practice belong. For more on whether a given PSAT number sets the student up for a competitive SAT, see are your PSAT results good enough for SAT success.
One pattern worth flagging. Students frequently misread the nationally representative percentile as their true standing. They see "87th percentile" and assume they're near the top of the competitive pool. The user percentile for the same score might be 72nd. Both numbers are real, but the user percentile reflects the students actually applying to selective colleges alongside your student.
Not Sure What Your PSAT Score Means for Your SAT Plan?
In 15 minutes, an IvyStrides coach will review your score report, identify your weakest section, and give you a concrete next step. No pressure, no pitch. Students and parents are both welcome on the call.
What Counts as a Good PSAT Score by Grade Level
"Good" is a grade-relative and target-relative word. A score that's excellent for a freshman would be middling for a junior aiming at a selective SAT target.
For a junior (11th grade): roughly 1150 puts you at the 75th percentile, roughly 1350 at the 90th, and 1370+ starts to enter the 99th percentile band. National Merit consideration lives near the top of that range and depends on your Selection Index and state, which we cover in the next section. For a deeper look at grade-specific benchmarks, including what a 1200 means for a sophomore versus a junior, see our full breakdown of what is a good PSAT score by grade.
For a sophomore (10th grade): roughly 1050 is the 75th percentile, 1200 the 90th, and 1420+ the 99th. On the PSAT 10 specifically, the 90th percentile lands near 1200, the 75th near 1080, and the 50th near 960. A 1200 as a sophomore is a strong result and typically signals a realistic path to a 1350+ SAT with focused prep across the next 12 to 18 months.
For a freshman or 8th grader: the PSAT 8/9 scale is 240 to 1440, so the numbers look different. A 1230 on the PSAT 8/9 is genuinely strong for a 9th grader, but it isn't directly comparable to a 1230 on the PSAT/NMSQT. Because the PSAT 8/9 doesn't qualify for National Merit, its real value is as an early diagnostic. What are the skill gaps, and how much runway is left before the junior-year PSAT/NMSQT?
One more caveat families sometimes skip. Even at test-optional schools, a PSAT score at or above roughly the 90th percentile can strengthen the decision to submit SAT scores. Test-optional policies vary by school and by year; FairTest maintains a current tracker, and every family should verify their target schools' policies directly on the school's admissions page before deciding whether to submit.
State also matters if National Merit is on the table. California, New Jersey, Massachusetts, and other high-competition states have Semifinalist cutoffs that sit well above the national Commended threshold. A 1350 that's the 90th percentile nationally may still fall short of Semifinalist consideration in those states.
PSAT Scores and the National Merit Scholarship Pathway
National Merit is where the total score stops being the answer. The National Merit Scholarship Program, administered through the PSAT/NMSQT, uses a separate metric called the Selection Index.
The Selection Index is calculated from your section scores, not your total. Reported on a 48 to 228 scale, it weights Reading and Writing content twice through the formula's structure and is what determines whether a junior earns Commended Student recognition or advances to Semifinalist in their state.
Here's why this matters more than families expect. Two juniors can have the same total score and different Selection Indexes. A student with 760 R&W and 710 Math (total 1470) can have a higher Selection Index than a student with a differently weighted section balance at the same total, because Reading and Writing carries additional weight in the calculation. Section balance is real, and an unbalanced 1470 does not always beat a balanced 1450 in the National Merit calculation.
Two thresholds matter:
- Commended Student is a national threshold. It typically sits around a Selection Index of roughly 207 to 209, though the exact cutoff shifts each cycle and only College Board's official release is authoritative.
- Semifinalist is state-specific. Cutoffs typically fall between roughly 209 and 222 depending on your state. California, New Jersey, and Massachusetts sit near the top of that range in most years. Less-populated states with fewer high-scoring test takers sit lower.
Only 11th-grade PSAT/NMSQT scores count for National Merit. Sophomores who take the PSAT/NMSQT aren't in the running for that year's competition. National Merit cutoffs are published by the College Board each year and vary by state, so always verify the current Selection Index threshold for your state before drawing conclusions from a total score alone. Don't rely on a prior year's numbers. For more on where specific score bands fall in the National Merit context, see is 1280 a good PSAT score. For test-date context, see our overview of when is the PSAT administered.
How Your PSAT Score Predicts SAT Readiness
The PSAT and SAT share the same College Board scoring framework and the same question types across Reading and Writing and Math. Because the two tests share that framework, your PSAT section scores map closely to projected SAT section scores, making this the right moment to set a realistic SAT target.
A student's first SAT attempt, taken a few months after the PSAT with structured prep, typically lands above their PSAT score. How much above depends on prep intensity and starting band. A junior with a 1150 PSAT (roughly the 75th percentile for 11th grade) is typically targeting a 1250 to 1350 SAT with roughly 3 to 4 months of focused prep. A junior with a 980 PSAT (roughly the 50th percentile) usually needs about 4 to 6 months of structured prep to reach a 1200+ SAT. These are typical ranges, not guarantees, and the actual delta depends on how consistently the student practices and whether the plan targets the weaker section.
In our coaching with students at the 920 to 1150 PSAT band who begin SAT prep within roughly four weeks of receiving scores, a diagnostic-driven plan typically produces gains of 200+ points by the target SAT sitting. Students who study every section equally, without letting the PSAT data direct the plan, usually see smaller gains and hit a plateau earlier. The methodology that works is boring and unglamorous: diagnostic first, targeted work on the weaker section, spaced full-length retesting, and a section-specialist coach for the harder gaps.
If your PSAT score is below your target percentile, the fastest way to close the gap is through full-length timed practice tests that mirror the digital adaptive format. Our library of best PSAT practice tests covers the format. For families who want a coach walking through score reports and running a targeted plan, our PSAT 1-on-1 prep is the structured path. For readers wondering how the two tests actually compare in difficulty, our post on is the PSAT harder than the SAT answers that directly.
Understanding Your PSAT Score Report
The score report contains four things worth reading in order: total score, section scores, subscores, and percentile columns.
Total score (320 to 1520) is the sum of your two section scores. It's what colleges and the media reference, but it's the least diagnostic number on the page.
Section scores (160 to 760 each for Reading and Writing and Math) are where prep decisions get made. The delta between the two sections tells you where to spend the next block of study time.
Subscores within each section identify the specific skill gaps. On the Math side, you'll see performance broken out across Algebra, Advanced Math, and Problem Solving and Data Analysis. On the Reading and Writing side, subscores cover Command of Evidence, Expression of Ideas, and related skill clusters. If a student has strong Algebra performance but weak Advanced Math, they know exactly where to spend their next practice block. Generic "study math harder" isn't a plan. "Spend three weeks on Advanced Math, specifically nonlinear functions and systems" is a plan.
Two percentile columns appear next to each score. User percentile compares your student to other students who actually took the PSAT that year. Nationally representative percentile compares to a modeled sample of all students in that grade. As covered earlier, user percentile is typically lower than nationally representative percentile, and user percentile is the number to trust for benchmarking against selective SAT competition.
Once scores are released, typically in mid-December for the October sitting, you'll have the data you need to run the percentile analysis in this guide. For the exact release timing and how to access the report, see when do PSAT scores come out.
Next Steps Based on Your Score Band
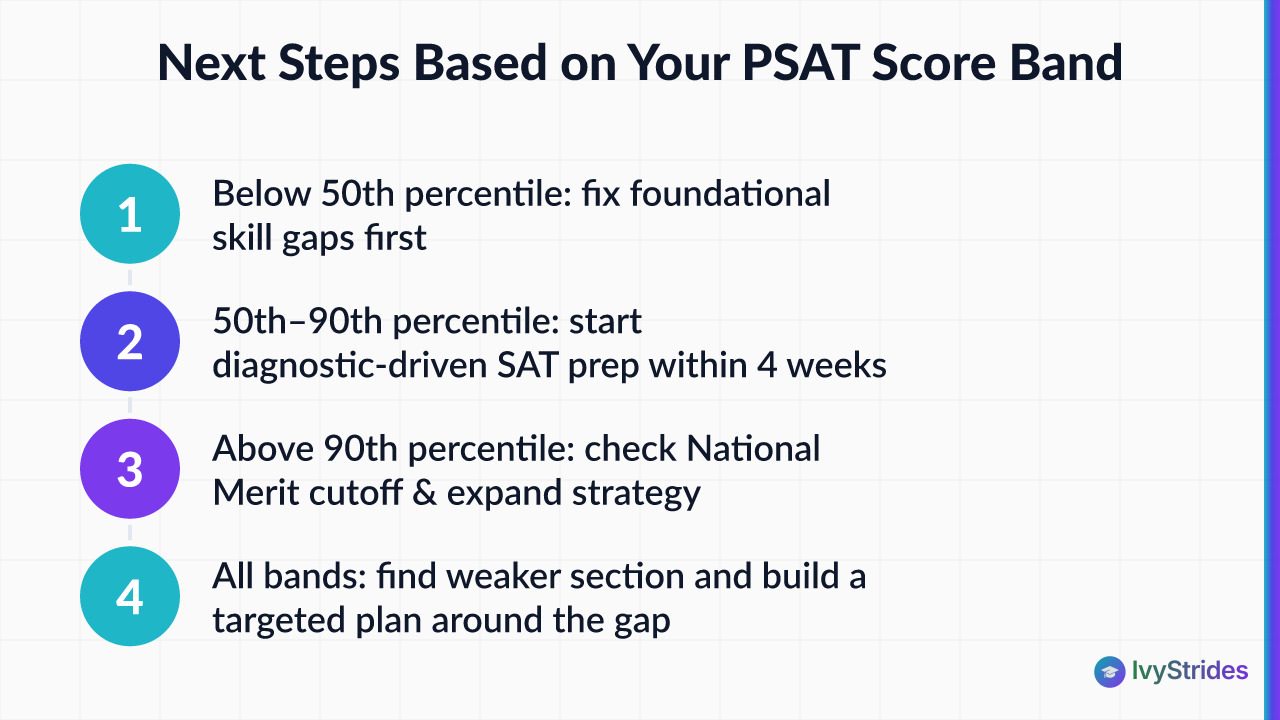
Different scores call for different actions. Here is the honest read on three bands.
Below the 50th percentile (below ~920 for 11th grade, below ~920 for 10th grade): the priority is foundational skill gaps, not test tactics. Pacing tricks and answer-elimination heuristics won't move the score meaningfully if the underlying algebra fluency or grammar rules aren't in place. Plan on a longer SAT runway of roughly 5 to 8 months, and start with subscore-level diagnosis. Which specific skill clusters are weak? Address those first. Our free downloads library has starter resources for students in this band.
50th to 90th percentile (roughly 920 to 1350 for 11th grade): this is the largest cohort and the band where a diagnostic-driven plan pays off fastest. In our coaching, students in the 920 to 1150 range who begin SAT prep within roughly four weeks of receiving PSAT scores and follow a section-targeted plan typically gain 200+ points by their target SAT sitting. The methodology matters. Random full-length practice without targeting the weaker section usually stalls and plateaus. Section-specialist work clears that plateau.
Above the 90th percentile (1350+ for 11th grade): the conversation shifts. National Merit becomes a live possibility, but the total score alone doesn't tell you if you qualify. Check your Selection Index against your state's most recent Semifinalist cutoff. If you're close, section balance matters as much as raw score. Simultaneously, the SAT target moves to 1450+, and admissions strategy expands. AP course choices, supplemental essays, and application strategy carry more weight than another 30 points on the SAT. A free 30-min SAT consultation is the right place to sort out which lever moves your admissions outcome the most.
Whichever band you're in, the next action is the same in structure: locate your score in the percentile table, identify the weaker section, and build a plan around the gap rather than around a generic prep book.
FAQ
What PSAT score puts a student in the top 1 percent?
A score of 1420 or above places a 10th grader in the top 1 percent (99th percentile). For 11th graders, the 99th percentile begins around 1370. A perfect score is 1520. These figures are drawn from the College Board PSAT/NMSQT user percentile tables and are updated annually.
Is a 980 a weak PSAT score?
A 980 is approximately the 50th percentile for 11th graders, which means it sits at the national middle for tested juniors. It's not a warning sign on its own. But if the target SAT is 1300+ and prep hasn't started, a 980 signals meaningful runway to cover and warrants a structured plan. The same 980 in 10th grade sits closer to the 60th percentile and reads differently.
Is a 740 Math section score on the PSAT considered strong?
Yes. A 740 on the PSAT Math section is at or near the 99th percentile for section scores; the maximum section score is 760. A 740 in Math combined with a solid Reading and Writing score puts a student well above the 90th percentile overall and in strong position for National Merit consideration, depending on Selection Index balance and state cutoff.
Is a 1200 a good score on the PSAT 10?
A 1200 on the PSAT 10 is approximately the 90th percentile for 10th graders. It's a strong result. The 75th percentile for PSAT 10 sits near 1080, and the 50th near 960. A 1200 signals solid SAT readiness and a realistic path to a 1350+ SAT with focused prep across the following year.
Does a 1470 PSAT score automatically qualify a student for National Merit?
Not necessarily. National Merit eligibility is based on the Selection Index, which is calculated from section scores using a weighted formula, not the total score alone. A student with a 1470 total but an unbalanced section split may have a lower Selection Index than a student with a 1450 total and balanced sections. State cutoffs also vary significantly, so a 1470 qualifies in some states and falls short of the Semifinalist threshold in high-competition states like California, New Jersey, and Massachusetts. Verify the current year's state cutoff before drawing conclusions.
What is a good PSAT score for a freshman or 9th grader?
Freshmen typically take the PSAT 8/9, which uses a 240 to 1440 scale rather than the 320 to 1520 scale of the PSAT/NMSQT. A score above roughly the 75th percentile on the PSAT 8/9 indicates strong academic preparation. Because the PSAT 8/9 doesn't qualify for National Merit, the primary value for freshmen is identifying skill gaps early and setting a trajectory toward a strong PSAT/NMSQT score in 11th grade.
How does a PSAT score in California compare to the national benchmark?
The PSAT percentile tables are national, so a 1350 is roughly the 90th percentile nationally regardless of state. For National Merit Semifinalist consideration, however, California has one of the highest state cutoffs in the country, typically requiring a Selection Index near the top of the roughly 209 to 222 range. A student who's at the 90th percentile nationally may still fall short of the California Semifinalist threshold. Verify the current California cutoff from the College Board before assuming eligibility.
The number on the score report is the starting line. What matters next is how you read the section split, which percentile column you trust, and whether the plan you build actually targets the weaker section.
Ready to Turn Your PSAT Score Into an SAT Plan?
Book a free 15-minute strategy call. We'll look at your section scores, set a realistic SAT target, and map out the prep path that fits your timeline. Students and parents are both welcome.

Award-winning author (South Asian Book Award) and graduate of BITS Pilani and UCLA Luskin School of Public Affairs. Brings a published writer's eye to Common App essays and grammatical precision to SAT and ACT R&W instruction.