
PSAT by Grade: A Smart Strategy for 9th, 10th, and 11th Graders (2026)
On this page
- What the PSAT Actually Is by Grade: 8/9, 10, and NMSQT Explained
- PSAT Score Benchmarks by Grade: What You Are Actually Aiming For
- 9th Grade PSAT Strategy: Baseline, Not Pressure
- 10th Grade PSAT Strategy: Building Real Momentum
- 11th Grade PSAT Strategy: The One Sitting That Counts for National Merit
- What a 1470 PSAT Score Means in SAT Terms (and How to Reach 1520)
- PSAT Reading and Writing Tips: What to Focus on by Score Band
- PSAT Math Tips: The Four Content Areas and Where Students Lose Points
- How to Turn Your PSAT Score Report Into an SAT Prep Plan
- FAQ
- Does a 1400 PSAT score qualify for National Merit?
- What is a top 1% PSAT score?
- What is a 1470 PSAT equivalent to on the SAT?
- Should I take the PSAT in 9th grade if it does not count for National Merit?
- How can I improve my PSAT score by 160 points?
- Is there a free PSAT study guide or practice test?
- Where to Go From Here
PSAT strategy should change by grade. In 9th grade, the PSAT 8/9 is a no-stakes diagnostic on a 240 to 1440 scale: take it, note weaknesses, move on. In 10th grade, the PSAT 10 or PSAT/NMSQT (both 320 to 1520) is a rehearsal where targeted prep on the weakest section starts to matter. In 11th grade, the PSAT/NMSQT is the only sitting that counts toward National Merit Scholarship consideration, so focused preparation is essential. Your grade determines your goal, your timeline, and how hard you should prepare.
These format and scoring facts trace back to the College Board PSAT/NMSQT program page, which is the authoritative source cited throughout. The harder question, and the one the rest of this article answers, is what to actually do with a PSAT score at each grade.

What the PSAT Actually Is by Grade: 8/9, 10, and NMSQT Explained
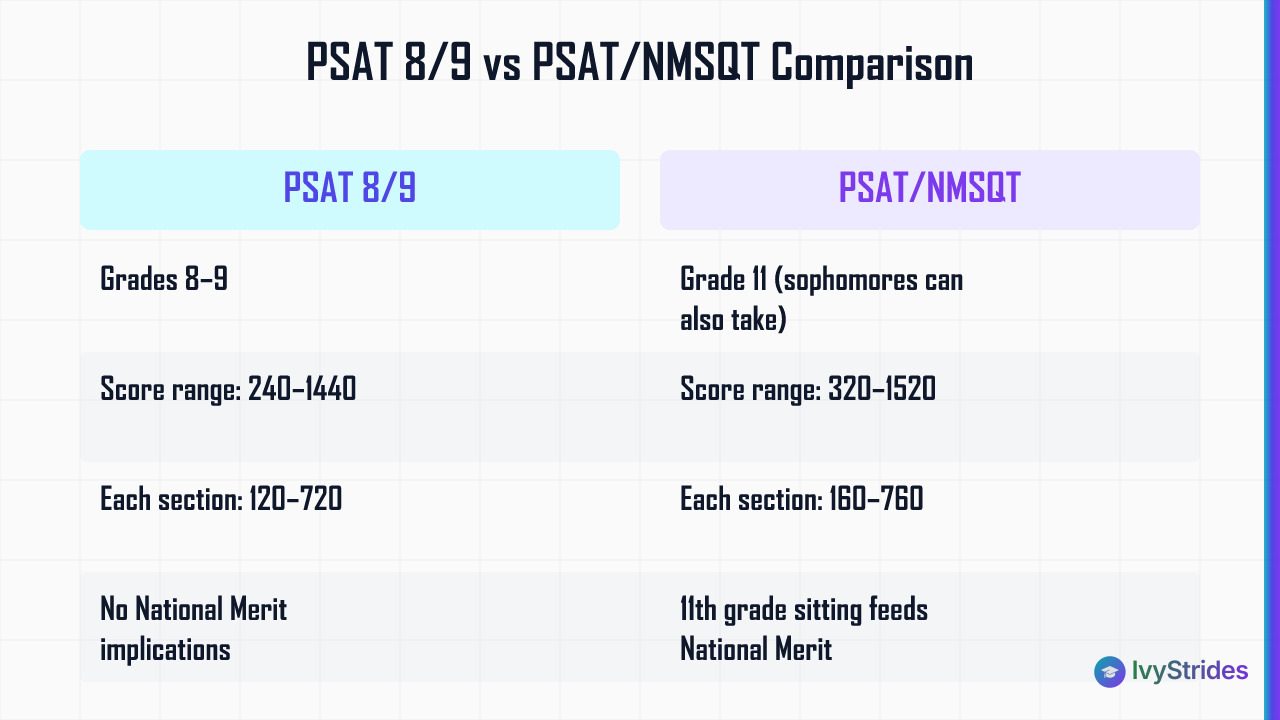
There isn't one PSAT. There are three, and they're calibrated to different grades with different score ranges and different stakes.
The PSAT 8/9 is designed for 8th and 9th graders. It scores on a 240 to 1440 scale, with two sections (Reading and Writing, Math) that each run 120 to 720. It carries no National Merit implications. Its job is baseline diagnosis.
The PSAT 10 is for 10th graders and is administered in the spring. It uses the same 320 to 1520 total scale as the PSAT/NMSQT, with each section ranging 160 to 760. It doesn't qualify for National Merit either.
The PSAT/NMSQT is the version most people mean when they say "the PSAT." It's administered in October, primarily to 11th graders (sophomores can take it too), and its 11th grade sitting is the only PSAT administration that feeds into the National Merit Scholarship Program.
All three are delivered digitally through the College Board's Bluebook app. All three use the same adaptive structure: two Reading and Writing modules and two Math modules, where performance on Module 1 determines the difficulty (and score ceiling) of Module 2. Total testing time is about 2 hours 14 minutes. For comparison, the SAT scores on a 400 to 1600 scale, so the PSAT ceiling of 1520 sits 80 points below a perfect SAT.
For a broader definition of what each score band signals, see our breakdown of what a good PSAT score looks like in 2026. To plan backward from test day, confirm your school's window in our PSAT test dates 2026 guide.
PSAT Score Benchmarks by Grade: What You Are Actually Aiming For
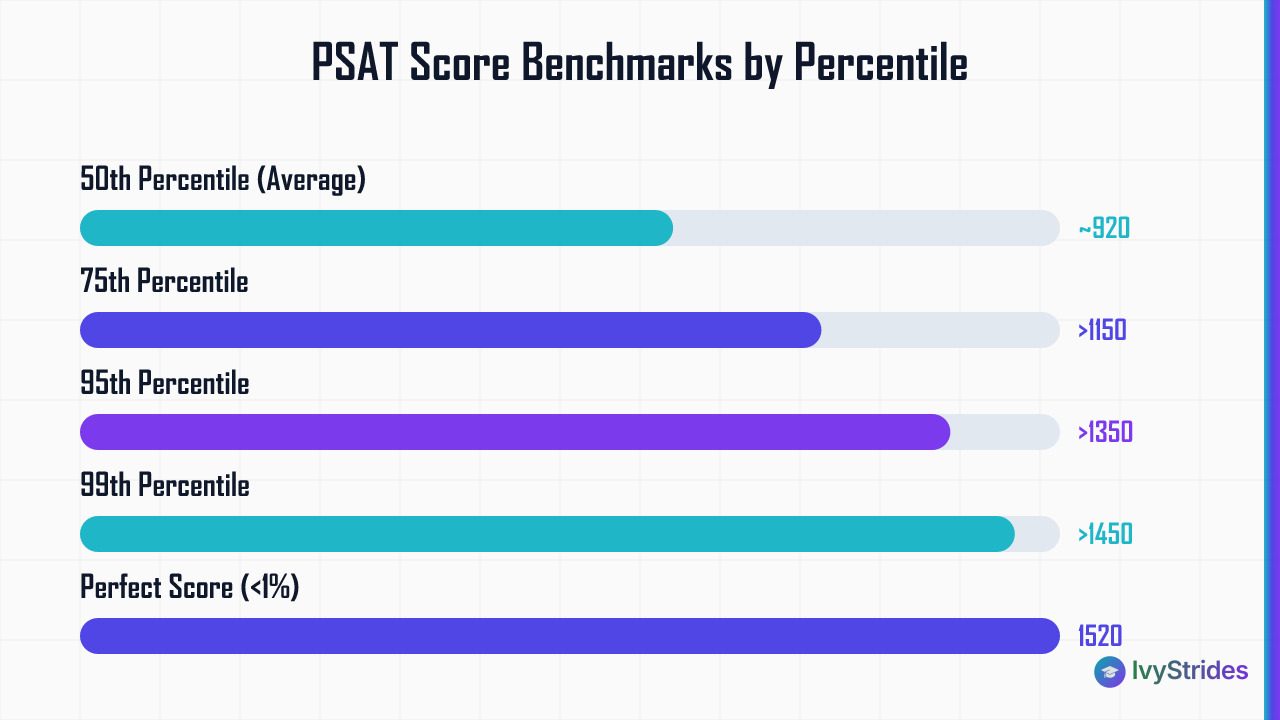
Percentiles matter more than raw scores because they tell you where you stand in the actual test-taker pool.
The average total PSAT score sits around 920, with roughly 460 on each section. That's 50th percentile territory. Above 1150 puts you above roughly the 75th percentile. Above 1350 clears about the 95th percentile. Above 1450 lands in roughly the 99th percentile band, and only a small fraction of test takers reach 1490 to 1520.
Break that down by grade. For 10th graders, a top 1% score falls in the 1420 to 1520 range. For 11th graders, the top 1% cutoff moves up to roughly 1490 to 1520, because juniors have had another year of school math and reading development. The perfect score, 1520, is achieved by fewer than 1% of test takers.
Quick reality check on scores students ask about. A 460 in Math is essentially average, not a strong starting point for a National Merit trajectory. A 1280 is above roughly the 75th percentile and competitive for many state universities. A 1480 is excellent, sitting in about the 99th percentile band, and puts a junior in serious National Merit contention in most states.
Sophomores can dig deeper into their band in our guide on good PSAT scores for 10th graders. Students wondering about a specific mid-range result can read is 1280 a good PSAT score.
9th Grade PSAT Strategy: Baseline, Not Pressure
Freshmen: relax. The PSAT 8/9 doesn't count for National Merit and doesn't appear on college applications. Its entire value is diagnostic.
Here's what to do. Take one full-length practice test in Bluebook a week or two before test day. That single exposure removes the "what does this even look like" panic and produces a score report that flags your weakest skill domains early. A 900 to 1000 in 9th grade is a reasonable starting point for many students, and there's no need to run a 10-week prep sprint for a test with zero admissions weight.
The score report breaks performance out across four Reading and Writing domains (Information and Ideas, Craft and Structure, Expression of Ideas, Standard English Conventions) and four Math content areas (Algebra, Advanced Math, Problem-Solving and Data Analysis, Geometry and Trigonometry). Circle the two lowest. Those become your quiet, low-intensity focus over the next year, folded into schoolwork rather than treated as a separate prep project.
Check our PSAT test dates 2026 article to confirm your school's administration window and plan your prep timeline backward from test day. When you're ready for a second exposure closer to test day, our PSAT practice tests library gives you additional full-length work in the digital format.
Parents: this is the year to normalize the test, not stress it. A calm 9th grade sitting makes the 10th and 11th grade sittings feel routine.
10th Grade PSAT Strategy: Building Real Momentum
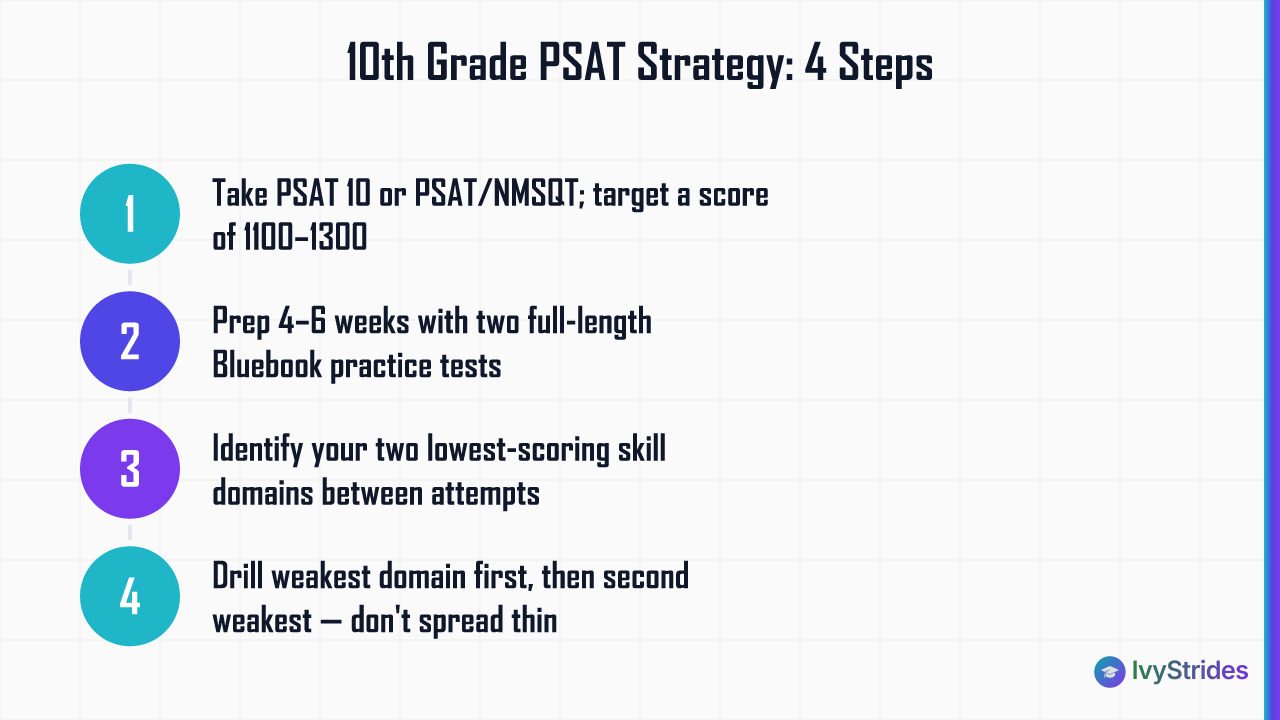
Sophomore year is the pivot. This is where the strategy meaningfully shifts from "meet the test" to "move the score."
You may take the PSAT 10 in the spring, the PSAT/NMSQT in the fall, or both, depending on what your school offers. Both use the same 320 to 1520 scale and the same format. Neither counts for National Merit. Both matter as rehearsals, and the score reports feed directly into your junior year plan.
Set a realistic 10th grade target in the 1100 to 1300 range. A score of roughly 1200 to 1300 suggests you're on track to be competitive in 11th grade with continued prep. If you're already above 1300 as a sophomore, National Merit is a realistic ambition, and prep intensity should reflect that.
A workable prep window is about 4 to 6 weeks of focused work before the test. Inside that window: two full-length Bluebook practice tests, spaced roughly two weeks apart, with targeted work on the two lowest-scoring skill domains between attempts. If your Math is 60 points behind your Reading and Writing, spend the majority of prep hours on Math, not on trying to inch up your stronger section.
Look. The mistake sophomores make is treating the PSAT 10 like a mini-SAT and grinding on both sections equally. In our coaching with students at the 1100 to 1300 band, the fastest gains come from identifying the single weakest content area and drilling that domain first, then the second weakest. Don't spread thin.
For a full week-by-week study schedule, our guide on how to study for the PSAT in 2026 pairs directly with the grade-level plans outlined here. Sophomores can also cross-reference the average PSAT score for 10th graders to see how their result compares to the national cohort.
11th Grade PSAT Strategy: The One Sitting That Counts for National Merit
Junior fall is the one PSAT sitting with real, quantifiable stakes. Only the 11th grade PSAT/NMSQT is used by the National Merit Scholarship Corporation to identify Commended Scholars, Semifinalists, and eventually Finalists.
Here's how the qualification math actually works. Your PSAT section scores are converted to a Selection Index, calculated roughly as 2 × (Reading and Writing section score + Math section score) on the scaled score, which produces a value between 48 and 228. The Commended Scholar cutoff is set nationally each year and typically lands around 207 to 209. Semifinalist cutoffs are set by state and usually range from about 209 to 222.
State variability isn't a footnote. It's the whole game. High-cutoff states like California, New Jersey, and Massachusetts often require a Selection Index near 221 or 222, which translates to roughly a 1480 total score or higher. Lower-cutoff states may see Semifinalist cutoffs closer to 210, achievable near 1400. So the honest answer to "does a 1400 qualify for National Merit" is: maybe, and it depends entirely on where you live. Verify the current year's state cutoff before you set a target.
The prep plan for a junior aiming at National Merit range looks different from a sophomore's plan. In our coaching, students targeting National Merit range typically need roughly 8 to 12 weeks of diagnostic-driven prep with section-specialist focus, meaning a Reading and Writing coach and a Math coach rather than one generalist. The methodology: a full-length Bluebook diagnostic, targeted weakness work by skill domain, spaced retesting every 4 to 6 weeks to measure and recalibrate.
One tactical point about the adaptive format that most competing guides ignore. To break above roughly 1400, you have to perform well enough on Module 1 in each section to unlock the harder Module 2. Miss too many questions in Module 1 and you're routed into an easier Module 2 with a lower score ceiling. This is why juniors targeting Semifinalist status can't afford sloppy early-module work. Every Module 1 question is a gate.
If you're a junior aiming for Commended or Semifinalist status, our full guide to the National Merit Scholarship cutoffs and qualification timeline covers state-by-state Selection Index cutoffs in detail. You can also read about how PSAT results connect to SAT success once the fall test is behind you.
One caveat worth stating plainly. National Merit is a valuable distinction and unlocks specific scholarships at certain universities, but admissions decisions still rest on the full application. A Semifinalist designation strengthens a file; it doesn't replace grades, essays, or the eventual SAT or ACT score.
What a 1470 PSAT Score Means in SAT Terms (and How to Reach 1520)
A 1470 PSAT is approximately equivalent to a 1500 to 1530 SAT score, based on the College Board's SAT Suite alignment. The scales are close but not identical: the PSAT tops out at 1520, the SAT at 1600, and the concordance handles the top-end compression. Your Bluebook score report includes a projected SAT range for this reason; use that projection as your starting SAT baseline, not a ceiling.
Reaching 1520 is a different conversation. A perfect PSAT requires roughly 760 in Reading and Writing and 760 in Math. Fewer than 1% of 11th grade test takers reach the 1490 to 1520 band. To get there, you have to perform well enough on Module 1 in each section to be routed into the hardest Module 2, then answer nearly every question in that harder Module 2 correctly. There's no path to 1520 that runs through the easier Module 2 track.
At the 1450 to 1520 range, error patterns become predictable. Reading and Writing points are typically lost on Craft and Structure questions (author's purpose, text structure, cross-text connections) and the most technical Expression of Ideas questions. Math points are typically lost on Advanced Math (nonlinear functions, polynomial behavior) and the harder Geometry and Trigonometry items. That's where a student aiming for perfection should spend prep time, not on shoring up basic algebra.
Once you have your PSAT score in hand, the next step is translating it into a realistic SAT target and a prep timeline, which our PSAT to SAT conversion guide walks through step by step. Students often wonder whether the difficulty jump from PSAT to SAT is significant; our comparison of PSAT vs SAT difficulty addresses that directly.
PSAT Reading and Writing Tips: What to Focus on by Score Band
The Reading and Writing section runs two modules of roughly 27 questions and 32 minutes each, per the College Board PSAT/NMSQT specification. Questions come from four domains: Information and Ideas, Craft and Structure, Expression of Ideas, and Standard English Conventions.
Error patterns change by score band, and this matters more than any generic "read every day" advice.
Students in the 900 to 1100 range lose the most points to Standard English Conventions (punctuation, subject-verb agreement, modifier placement) and to the more literal Information and Ideas questions. Those are the highest-yield targets first. Grammar is teachable in weeks; interpretive reading takes longer.
Students in the 1200 to 1350 range have usually cleaned up basic grammar and are losing points on Craft and Structure (author's rhetorical choices, cross-text comparisons) and on the trickier Expression of Ideas questions that require holding an argument together across a short passage.
Students in the 1400+ range are losing 2 to 4 questions total, usually to the hardest Craft and Structure items with dense literary or historical passages. In our coaching, students who improve their Reading and Writing score by roughly 50 to 80 points typically do so by targeting Standard English Conventions and Information and Ideas first, because those domains have more questions per module and are more responsive to short-cycle drilling.
A pacing rule that holds across bands: aim to spend no more than about 75 seconds per question in Module 1. You need clean, deliberate work in Module 1 to unlock the harder Module 2 and its higher score ceiling. Rushing Module 1 to save time for Module 2 is exactly backward.
For a broader look at how these same skill domains carry into junior and senior year testing, see how to study for the SAT in 2026.
PSAT Math Tips: The Four Content Areas and Where Students Lose Points
The Math section is two modules of roughly 22 questions and 35 minutes each. Calculator is permitted throughout, with the Desmos graphing calculator built into Bluebook.
Content coverage is uneven, which shapes prep priority. Algebra makes up roughly 35% of Math questions. Advanced Math makes up roughly another 35%. Problem-Solving and Data Analysis is about 15%, and Geometry and Trigonometry is about 15%. So roughly 70% of your Math score depends on Algebra and Advanced Math combined. Spend accordingly.
Where students lose points, band by band. In the 900 to 1100 range, the biggest leak is linear equations and systems of equations in the Algebra domain. In the 1200 to 1350 range, students clear linear work but lose points on quadratic and polynomial functions in Advanced Math. Above 1400, the losses concentrate in the hardest Advanced Math items and in Geometry and Trigonometry problems that require multi-step setup.
In our coaching, students who address their top two Math content-area weaknesses first see the fastest score gains, typically around 40 to 80 points on Math within a roughly 8-week window at the 1100 to 1300 band. Trying to improve everything at once produces slower, thinner gains.
A tactical note on Desmos. Because the built-in graphing calculator is available for every Math question, learning to graph quadratics quickly, check linear systems visually, and evaluate function values in Desmos saves meaningful time. Students who ignore Desmos and hand-compute everything are giving up an advantage the digital format was designed to reward.
For a common error pattern that costs points at nearly every band, see quadratic formula mistakes that cost SAT points. To run additional full-length Math sections in the adaptive format, our PSAT practice tests library provides Bluebook-aligned work.
How to Turn Your PSAT Score Report Into an SAT Prep Plan
Your PSAT score report is a diagnostic, not just a scorecard. Read it that way.
Every Bluebook score report includes section scores (Reading and Writing, Math), subscore performance across the four domains in each section, question-level right/wrong feedback, and a projected SAT score range. That last field is the College Board's own concordance estimate of where your SAT would land if you tested tomorrow.
Here's how to use it. Identify the two lowest-performing skill domains across your report, regardless of section. Those are your highest-use targets. A student scoring 1200 on the PSAT can project an SAT of roughly 1230 to 1280 as a starting baseline. That baseline isn't a ceiling; with targeted prep, gains of about 100 to 200 points on the SAT are typical for students at this band who complete a full diagnostic-driven cycle.
The methodology we use with every student: take a full-length Bluebook SAT practice test as the SAT diagnostic, identify the two to three weakest skill domains, build a targeted prep plan around those domains, retest every 4 to 6 weeks, adjust. In our coaching, students who begin SAT prep within about 4 to 6 weeks of receiving their PSAT score report make faster progress than those who wait until spring of junior year. The reason is simple: the material is fresh, pacing habits are still active, and there's time to run three or four full diagnostic cycles before the first SAT sitting.
One qualitative pattern from our coaching: students who plateau between weeks 4 and 6 of an SAT cycle are almost always repeating the same 2 to 3 error types across practice tests. The fix isn't more tests, it's a coach reviewing which error types are recurring and rebuilding drills around those specific gaps.
For the mechanical conversion from PSAT to SAT and how to set a realistic SAT target, our PSAT to SAT score planning guide walks through the process. If you're wondering whether the SAT will feel harder than the PSAT you just took, is the PSAT harder than the SAT covers the difficulty differential. When you're ready for section-specialist support, 1-on-1 PSAT prep pairs students with Reading and Writing and Math coaches who work exclusively in their assigned section.
FAQ
Does a 1400 PSAT score qualify for National Merit?
Maybe, and it depends entirely on your state. National Merit qualification is based on your Selection Index, not directly on your total score, and state Semifinalist cutoffs vary from roughly 209 to 222. In lower-cutoff states, a 1400 can be competitive for Semifinalist consideration. In high-cutoff states like California, New Jersey, or Massachusetts, the Semifinalist cutoff often corresponds to a score closer to 1480. Check the most recent state-specific cutoffs each year, and note that the national Commended Scholar threshold typically sits around 207 to 209 Selection Index.
What is a top 1% PSAT score?
For 10th graders, a score between roughly 1420 and 1520 places a student in the top 1%. For 11th graders, the top 1% threshold rises to roughly 1490 to 1520 because the junior test-taking pool is stronger. The perfect PSAT is 1520. In our coaching, students who reach the top 1% have typically completed 8 to 12 full-length practice tests and received section-specialist support to close their weakest skill domains.
What is a 1470 PSAT equivalent to on the SAT?
A 1470 PSAT is approximately equivalent to a 1500 to 1530 SAT score based on the College Board's SAT Suite score alignment. The PSAT and SAT share a scoring framework, but the PSAT maxes out at 1520 while the SAT reaches 1600, so the top-end concordance handles the compression. Your Bluebook score report includes a projected SAT range specific to your performance profile; use that individual projection rather than a generic conversion table.
Should I take the PSAT in 9th grade if it does not count for National Merit?
Yes. The PSAT 8/9 gives you a real baseline score in the digital adaptive format, removes first-time-test anxiety before the stakes rise, and produces a score report that flags your weakest skill domains early. Students who use their freshman score report to guide 10th and 11th grade prep tend to enter their National Merit-eligible sitting more prepared than students who saw the format for the first time as juniors.
How can I improve my PSAT score by 160 points?
A gain of about 160 points is achievable for most students with enough lead time. In our coaching, students who improve by roughly 150 points or more typically follow the same pattern: start with a full-length Bluebook diagnostic, identify the two to three weakest skill domains, complete targeted practice on those domains with section-specialist support, and retest every 4 to 6 weeks to measure progress. A roughly 10 to 14 week prep window is typical for a gain of this size, though results depend on starting score, hours of focused work, and consistency.
Is there a free PSAT study guide or practice test?
Yes. The College Board's Bluebook app provides free official digital PSAT practice tests that mirror the actual adaptive format, and the College Board PSAT/NMSQT practice page hosts additional free resources. IvyStrides also offers free downloads including score-tracking tools to help you organize practice test results and identify patterns across attempts.
Where to Go From Here
The right PSAT plan isn't the same in 9th, 10th, and 11th grade. Freshmen build a baseline. Sophomores build momentum. Juniors compete for National Merit and set the SAT trajectory. Match the intensity to the grade, then let the score report drive the specifics.

Award-winning author (South Asian Book Award) and graduate of BITS Pilani and UCLA Luskin School of Public Affairs. Brings a published writer's eye to Common App essays and grammatical precision to SAT and ACT R&W instruction.