
PSAT to SAT: How to Use Your PSAT Score to Plan Your SAT Strategy (2026)
On this page
- What Your PSAT Score Actually Predicts on the SAT (The Short Answer)
- PSAT to SAT Conversion Chart: Predicted SAT Scores by PSAT Band
- Why Your PSAT Score Is Not Your SAT Score (and What the Gap Actually Means)
- Translating Specific PSAT Scores: What Does Your Number Mean for the SAT?
- PSAT 10 and PSAT 8/9: How the Conversion Changes by Grade
- How to Turn Your PSAT Gap Into a Targeted SAT Prep Plan
- Reading Your PSAT Score Report: Section Subscores and What to Prioritize
- PSAT Scores and National Merit: The Conversion That Actually Has a Deadline
- FAQ
- What does a 1300 on the PSAT equal on the SAT?
- What is a 1470 PSAT equivalent to on the SAT?
- What is a 1240 on the PSAT in SAT terms?
- How do you convert a PSAT score to an SAT score?
- Is the PSAT a reliable predictor of the SAT?
- How much can I realistically improve from my PSAT score to my SAT score?
Your PSAT score predicts your SAT score because both tests share the same scoring scale inside the College Board SAT Suite of Assessments. The PSAT/NMSQT and PSAT 10 top out at 1520; the Digital SAT tops out at 1600. Most students score roughly 40 to 80 points higher on the SAT than on the PSAT/NMSQT when both are taken under similar conditions. A 1300 PSAT typically predicts an SAT in the 1340-1380 range. A 1440 PSAT typically predicts an SAT in the 1480-1520 range. The conversion is a baseline, not a ceiling.
These ranges come from College Board concordance data published at satsuite.collegeboard.org. The harder question, and the one this article actually solves, is how to read your PSAT section subscores to figure out which half of the gap to close first, and how many weeks of targeted work stand between your predicted SAT and your target SAT.
What Your PSAT Score Actually Predicts on the SAT (The Short Answer)
The PSAT and SAT sit on the same score ladder. That ladder is called the SAT Suite of Assessments, and it runs from PSAT 8/9 (240-1440) through PSAT 10 and PSAT/NMSQT (score range 320-1520) up to the Digital SAT (score range 400-1600). Because the tests share a scale, a PSAT composite already reads as a rough SAT number. You just need the offset.
For the PSAT/NMSQT, the offset most students see is roughly +40 to +80 points on their SAT composite, taken without additional prep in between. Two anchors:
- A 1300 PSAT/NMSQT predicts an SAT in the 1340-1380 range.
- A 1440 PSAT/NMSQT predicts an SAT in the 1480-1520 range.
These aren't fixed formulas. They come from the College Board concordance table, which maps PSAT composite scores to predicted SAT composite ranges based on how the two tests are calibrated against each other. The concordance is a prediction under equal conditions. It assumes you walk into the SAT with the same preparation level, focus, and content mastery you brought to the PSAT. Actual outcomes shift the moment you start prepping.
For a fuller side-by-side on the two tests, see the difference between SAT and PSAT.
PSAT to SAT Conversion Chart: Predicted SAT Scores by PSAT Band
Here is the reference table, drawn from College Board concordance data. Find your PSAT composite band, then read across for your predicted SAT range and the typical gap at that band.
| PSAT/NMSQT Composite | Predicted SAT Composite | Typical Gap |
| 800-840 | roughly 840-900 | +40 to +60 |
| 850-890 | roughly 890-950 | +40 to +60 |
| 900-940 | roughly 940-1000 | +40 to +60 |
| 950-990 | roughly 990-1050 | +40 to +60 |
| 1000-1040 | roughly 1040-1100 | +40 to +60 |
| 1050-1090 | roughly 1090-1150 | +40 to +60 |
| 1100-1140 | roughly 1140-1200 | +40 to +60 |
| 1150-1190 | roughly 1190-1250 | +40 to +60 |
| 1200-1240 | roughly 1240-1300 | +40 to +60 |
| 1250-1290 | roughly 1290-1350 | +40 to +60 |
| 1300-1340 | roughly 1340-1400 | +40 to +60 |
| 1350-1390 | roughly 1390-1450 | +40 to +60 |
| 1400-1440 | roughly 1440-1500 | +40 to +80 |
| 1450-1490 | roughly 1490-1560 | +40 to +70 |
| 1500-1520 | roughly 1540-1580 | +40 to +60 |
Before you use the conversion table, it helps to know where your PSAT sits relative to national percentiles; see our breakdown of what is a good PSAT score by grade. If you scored right at the 1280 mark, we have a targeted read on whether is 1280 a good PSAT score at your grade level.
Two notes on reading the table.
The typical gap narrows near the ceiling. Once you cross 1500 on the PSAT, the physical 1520 cap means the concordance can only stretch so far. The final push from a 1520 predicted to a 1580-1600 actual is the hardest part of the curve, and it lives almost entirely in the SAT's hardest Module 2 questions, which the PSAT doesn't include.
The composite hides the real story. A 1300 built on 700 R&W plus 600 Math needs a very different prep plan than a 1300 built on 600 R&W plus 700 Math. Your section subscores are where the plan actually starts, and a later section walks through that in detail.
Why Your PSAT Score Is Not Your SAT Score (and What the Gap Actually Means)
The two tests are close cousins, not twins. Both the Digital PSAT and Digital SAT use the same two-section adaptive structure per the College Board: a Reading and Writing section and a Math section, each split into two adaptive modules. Your performance on Module 1 routes you into an easier or harder Module 2. So far, identical.
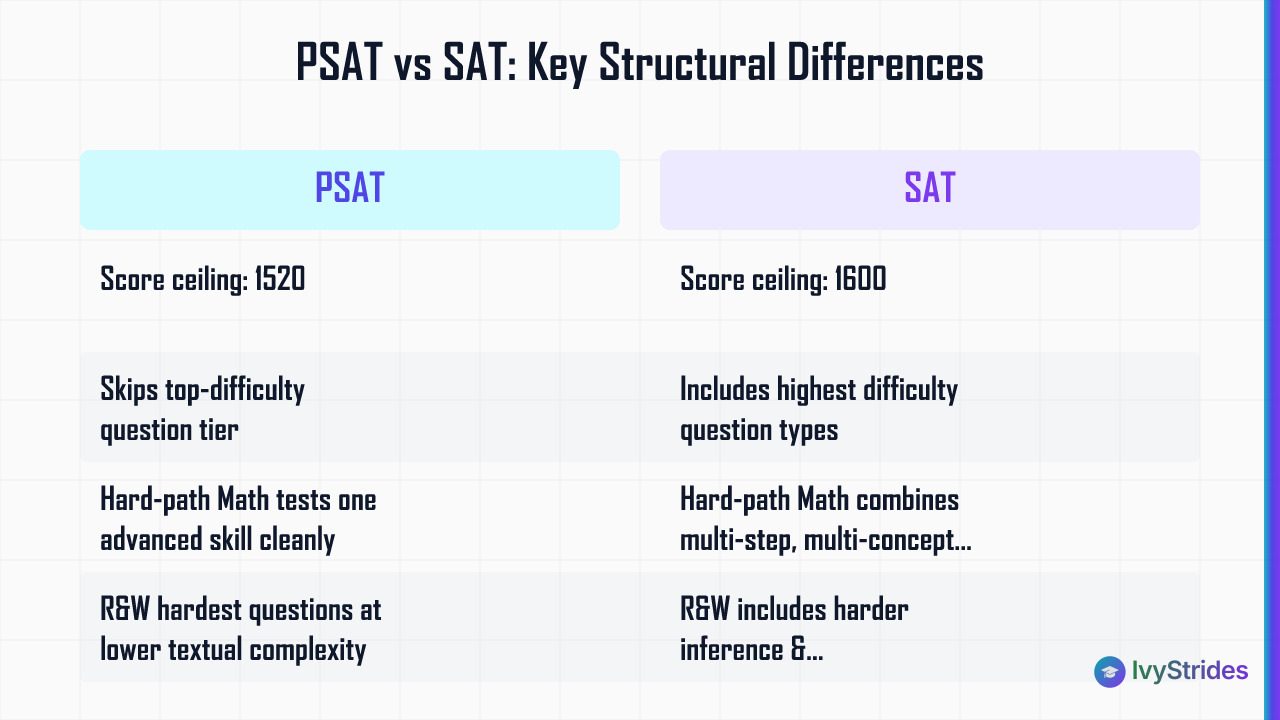
The score gap between the two tests reflects real structural differences in question difficulty ceiling and adaptive module design, which our SAT vs PSAT comparison covers in detail. Here's the short version. The SAT's hard-path Module 2 contains question types and difficulty levels that don't appear on the PSAT. That's why the SAT ceiling is 1600 and the PSAT ceiling is 1520. The 80-point ceiling gap is designed in, not a scoring quirk.
What does that mean in practice? On SAT Math Module 2 hard path, you'll see multi-step problems combining function transformations with quadratic systems, or geometry problems that require you to hold three relationships in working memory at once. On PSAT Math, the ceiling questions are more likely to test one advanced skill cleanly. Same with R&W: the hardest SAT inference and rhetorical-synthesis questions push a level of textual complexity you rarely see on the PSAT.
Students often ask whether the PSAT is just an easier SAT. The answer is more layered than difficulty alone, and we cover the structural reasons in our comparison of is the PSAT harder than the SAT. Short version: the PSAT is not universally easier. It's calibrated for a specific score range and skips the top-difficulty tier.
Translating Specific PSAT Scores: What Does Your Number Mean for the SAT?
A closer read on the score bands most students actually search for.
1180 PSAT to SAT. A 1180 PSAT/NMSQT predicts an SAT of roughly 1220-1260. This band usually shows a clear section imbalance, and closing roughly 40 to 60 points of gap in the weaker section is often the fastest lift. Students at this band typically need roughly 60 to 100 hours of focused prep to move meaningfully above the predicted range.
1240 PSAT to SAT. A 1240 predicts roughly 1280-1320 on the SAT. In our coaching at this band, the biggest wins usually come from Advanced Math and Standard English Conventions, both of which reward pattern recognition over raw content review.
1300 PSAT to SAT. A 1300 predicts roughly 1340-1380 on the SAT. This is the most common band where students underestimate what's possible. A well-run prep plan of roughly 40 to 60 hours often pushes actual SAT scores into the 1400-1450 range.
1400 PSAT to SAT. A 1400 predicts roughly 1440-1490 on the SAT. At this band, section subscores start to matter more than composite. If your Math is already at 720 on the PSAT, gains will come from R&W. If R&W is at 720, Math is your lever.
1440 PSAT to SAT. A 1440 predicts roughly 1480-1520 on the SAT. This is a strong college-application score band, and prep at this level focuses almost entirely on Module 2 hard-path question types.
1470 PSAT to SAT. A 1470 predicts roughly 1510-1550 on the SAT. The 30 to 50-point path from predicted to a 1550-plus SAT is a Module 2 problem, specifically the hardest 3 to 4 questions per section.
1500 PSAT to SAT. A 1500 predicts roughly 1540-1570 on the SAT. At this band, the physical PSAT ceiling of 1520 compresses the concordance, and the SAT is your first real shot at a 1580-1600. For grade-specific context on where these numbers put you, our guide to PSAT results 2026 walks through the score-to-college-target math.
These are concordance-based estimates, not guarantees. Your actual SAT score depends on prep effort, test conditions, and how well you've addressed the specific weak question types your PSAT subscores exposed.
PSAT 10 and PSAT 8/9: How the Conversion Changes by Grade
Not every PSAT is the same test. The College Board runs three versions, and the conversion offset changes by grade.
PSAT/NMSQT (11th grade, some 10th graders). Score range 320-1520. This is the version tied to National Merit qualification. Conversion offset to the SAT is roughly +40 to +80 points.
PSAT 10 (spring of 10th grade). Score range 320-1520, same format as PSAT/NMSQT. Conversion to the SAT is similar, roughly +40 to +80 points, but you have more runway. A 1300 PSAT 10 in spring of 10th grade often becomes a 1450-plus SAT by junior fall with a structured 3 to 4-month prep plan. If you're a sophomore reading this after your PSAT 10 results, our guide to good PSAT scores for 10th graders gives grade-specific context for your number.
PSAT 8/9 (8th or 9th grade). Score range 240-1440. The offset is much larger. College Board's PSAT 8/9 understanding-scores documentation suggests adding roughly +160 points to estimate an SAT-equivalent. A 1200 on PSAT 8/9 in 8th grade doesn't read the same as a 1200 on PSAT/NMSQT in 11th grade; they map to very different SAT predictions and college targets.
Only the 11th-grade PSAT/NMSQT sitting qualifies for National Merit. PSAT 10 and PSAT 8/9 don't, no matter the score. If your student is in 9th or 10th grade, the highest-value use of the PSAT is diagnostic, not scholarship. Use it to identify which section needs the most work, then build a 12 to 24-month prep runway. Our PSAT practice tests library gives you full-length simulated PSATs to track progress.
How to Turn Your PSAT Gap Into a Targeted SAT Prep Plan
Once you know your predicted SAT score, the next question is how many points you need to close and how to close them efficiently. Our how to improve your SAT score playbook walks through the exact methodology. Here's the compressed version, built around IvyStrides' diagnostic plus targeted-weakness plus spaced-retesting framework.
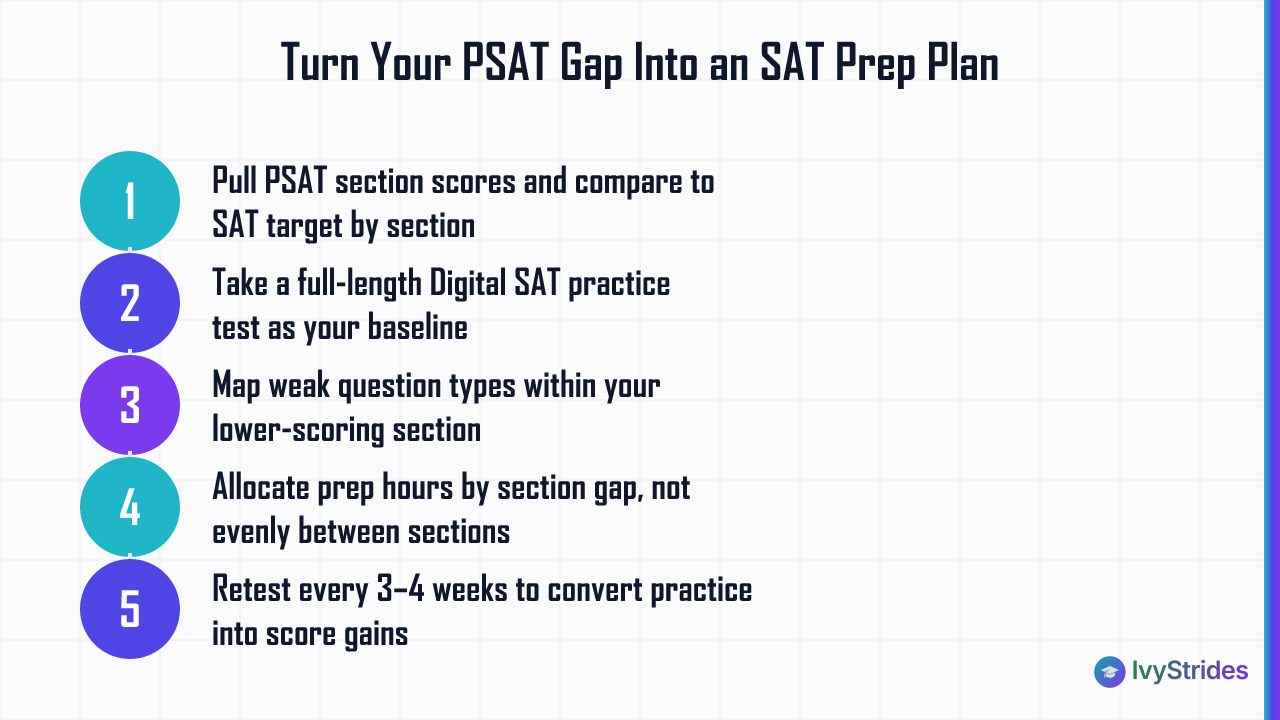
Step 1: Pull your PSAT section scores. Each section (R&W and Math) is scored 160-760. Compare each to your SAT target section score. If your target SAT is 1500 (typically around 750 R&W plus 750 Math), and your PSAT was 680 R&W plus 640 Math, your Math gap is larger. Math becomes your lead priority.
Step 2: Take a full-length Digital SAT practice test. Don't rely on your PSAT alone as the baseline. The SAT's Module 2 hard path is where predictions break down, and a real SAT practice test gives you a true diagnostic. This is the single highest-value hour you can spend in the first week of prep.
Step 3: Map weak question types within the lower section. In SAT R&W, that usually means Command of Evidence, Transitions, or Rhetorical Synthesis. In SAT Math, it usually means Advanced Math (function transformations, quadratic systems) or Problem-Solving and Data Analysis. Your practice test scoring report surfaces these by category.
Step 4: Allocate prep hours by section weight. For a student targeting a 100-point composite gain, roughly 40 to 60 hours of focused practice is a typical baseline. For a 150 to 200-point gain, plan on roughly 60 to 100 hours. Split the hours between your two sections in proportion to the gap, not evenly.
Step 5: Retest every 3 to 4 weeks. Spaced retesting is what converts practice into score movement. Without a real full-length retest on that cadence, students plateau because they never rebuild the pacing and endurance the actual test demands.
In our coaching with students at the 1200-1350 PSAT band, a 150 to 200-point SAT improvement is typical for students completing a full diagnostic-led program. At the 1350-1470 band, typical gains are 50 to 120 points above the predicted concordance range. Your PSAT result is also a useful input when building a broader high school testing timeline that includes AP exams and a potential ACT attempt; our AP, SAT, and ACT testing plan covers the full sequencing.
If you want an outside eye on your gap and section split before you start, our free SAT consultation is built exactly for that.
Reading Your PSAT Score Report: Section Subscores and What to Prioritize

Photo by Andy Barbour on Pexels
The composite hides the real prep signals. Your PSAT score report shows more than two section scores, and those inner numbers are where prep planning actually starts.
Section-level mapping. The PSAT R&W section is scored 160-760; SAT R&W is scored 200-800. A PSAT R&W of 620 predicts an SAT R&W of roughly 640-660. The PSAT Math section is scored 160-760; SAT Math is scored 200-800. A PSAT Math of 660 predicts an SAT Math of roughly 680-720. If your two section scores are more than about 60 points apart, your prep plan should weight heavily toward the lower one.
Subscore categories. The PSAT report breaks each section into content-area subscores. On R&W: Information and Ideas, Craft and Structure, Expression of Ideas, and Standard English Conventions. On Math: Algebra, Advanced Math, and Problem-Solving and Data Analysis. Each is scored on a smaller scale, typically out of 15.
Look at these subscores hard. A student with a 620 R&W built on strong Craft and Structure but weak Standard English Conventions has a very different prep plan than a student with the reverse split. Conventions questions reward rule mastery in a way that returns points quickly. Craft and Structure questions require deeper inference practice, which takes longer to move.
Here's the part most students miss. If your Math subscore for Advanced Math is below 6 out of 15, that's your highest-use area to address before the SAT. Advanced Math is the subscore most correlated with Module 2 hard-path performance, and it's the single largest predictor of whether a student breaks 700 in SAT Math. Our sat mistake tracker is built to help you log which subscore categories your errors cluster in.
PSAT Scores and National Merit: The Conversion That Actually Has a Deadline
If you're an 11th grader, your PSAT/NMSQT does one thing your SAT never can: it puts you in the National Merit Scholarship pool. Most of this article is about long-term score planning. This section is about a hard-deadline sub-question that only 11th-grade PSAT/NMSQT scores answer.
The Selection Index. National Merit uses a Selection Index calculated from your PSAT/NMSQT R&W and Math section scores. Verify the exact formula and maximum for your test year at satsuite.collegeboard.org/psat-nmsqt, because College Board occasionally adjusts the calculation and the numbers below shift year to year.
Commended vs. Semifinalist. The Commended threshold has typically fallen in the range of roughly 207-209 Selection Index nationally, though this shifts year to year. Semifinalist cutoffs vary by state and typically fall between roughly 209 and 222, with the most competitive states (California, New Jersey, Massachusetts, Texas) sitting at the top of that range.
Only 11th-grade PSAT/NMSQT qualifies. A 1500 on your PSAT 10 doesn't put you in the running. Only the fall junior-year sitting counts for the National Merit cutoff.
Two caveats. Cutoffs change annually, so verify the current year's numbers directly at College Board rather than relying on a blog post (including this one). And National Merit is not admissions; it's a scholarship program with its own timeline, its own downstream Finalist requirements, and its own decoupled path from your Digital SAT plan. For the fuller comparison of what each test does and when, see psat vs sat.
FAQ
What does a 1300 on the PSAT equal on the SAT?
A 1300 PSAT/NMSQT score predicts an SAT score in the range of roughly 1340 to 1380, based on College Board concordance data. The exact SAT score depends on prep effort between the two tests. Students who complete a structured prep program after a 1300 PSAT frequently score above the predicted range, often into the 1400-1450 zone with roughly 40 to 60 hours of targeted work.
What is a 1470 PSAT equivalent to on the SAT?
A 1470 PSAT/NMSQT score corresponds to a predicted SAT score of roughly 1510 to 1550. At this band, the gap to a 1600 SAT is narrow but meaningful. The highest-difficulty SAT Math Module 2 questions and the hardest R&W inference questions are the primary differentiators, and prep at this level should focus almost entirely on those specific question types rather than broad content review.
What is a 1240 on the PSAT in SAT terms?
A 1240 PSAT/NMSQT score predicts an SAT score of roughly 1280 to 1320. Students at this band typically have a clear section imbalance between R&W and Math that a diagnostic practice test will surface. Identifying which section is lower, and which subscore inside that section is weakest, is the highest-use starting point for prep.
How do you convert a PSAT score to an SAT score?
The most reliable method is to use the College Board's official concordance table, which maps each PSAT composite score to a predicted SAT composite range. As a quick estimate, add roughly 40 to 80 points to a PSAT/NMSQT composite for a rough SAT prediction. For PSAT 8/9, the offset is larger, roughly 160 points, because the test is designed for younger students and covers a narrower difficulty range.
Is the PSAT a reliable predictor of the SAT?
Yes. The PSAT is a reasonably reliable predictor of SAT performance when both tests are taken without additional prep in between. Both are part of the College Board SAT Suite and share the same adaptive format and scoring scale, so the correlation is strong. The prediction assumes similar conditions; students who prep specifically for the SAT between the two tests typically score above their predicted range.
How much can I realistically improve from my PSAT score to my SAT score?
In our coaching with students at the 1200-1350 PSAT band, a 150 to 200-point SAT improvement above the predicted conversion score is typical for students completing a full diagnostic-led program with roughly 40 to 80 hours of targeted practice. Students at the 1350-1470 PSAT band typically see 50 to 120-point gains above prediction. Improvement depends on starting score, section-specific weaknesses, and time invested before test day.
Your PSAT is a starting line, not a verdict. The conversion table tells you where the passive path leads. Your section subscores tell you where the active path bends. IvyStrides' 1-on-1 SAT program is built around exactly this pivot: a diagnostic-led read of your PSAT report, a targeted plan for the weakest subscore category, and spaced retesting to lock in the gain. You can meet the tutors who coach students at your score band. To learn more about how we structure the program, read about IvyStrides.

Award-winning author (South Asian Book Award) and graduate of BITS Pilani and UCLA Luskin School of Public Affairs. Brings a published writer's eye to Common App essays and grammatical precision to SAT and ACT R&W instruction.