
How to Read your PSAT Score Report in 2026: A Step-by-Step Guide That Actually Works
On this page
- What Your PSAT Score Report Shows at a Glance (And Where to Find It)
- Step 1: How to Access Your PSAT Score Report Online
- What Every Number on Your PSAT Score Report Actually Means
- The Score That Confuses Everyone: How to Read the PSAT Selection Index
- PSAT Score Benchmarks: What Is a Good Score for Your Grade?
- How to Use Your Subscores to Find the Exact Skills Holding You Back
- How to Turn Your PSAT Score Report Into an SAT Prep Plan
- FAQ
- Is the PSAT scored out of 1440 or 1520?
- Is a 1200 a bad PSAT score?
- What PSAT score puts you in the top 1%?
- Does a 1470 PSAT score qualify for National Merit?
- Why can I not see my PSAT score report online?
- What is a good PSAT score for a sophomore?
- Your Next Step
Your PSAT/NMSQT score report shows a Total Score from 320 to 1520, built from two section scores: Reading and Writing (160-760) and Math (160-760). It also carries a national percentile rank, a Selection Index used for National Merit eligibility, and seven subscores that pinpoint specific skill gaps. You access the full report through your College Board student account at studentscores.collegeboard.org or through the BigFuture School app. Reading every layer, not just the total, is what turns a score into a prep plan.
Those numbers come from College Board's official PSAT/NMSQT documentation, which is the source cited throughout this guide. The harder question, and the one the next sections answer, is how to read the report as a diagnostic instead of a report card.
What Your PSAT Score Report Shows at a Glance (And Where to Find It)
Here's the full inventory of what appears on a PSAT/NMSQT report:
- Total Score, 320 to 1520
- Reading and Writing section score, 160 to 760
- Math section score, 160 to 760
- National percentile rank and user percentile rank
- Selection Index (for 11th graders only, used for National Merit)
- Seven subscores covering specific skill areas, each on a 1-15 scale
- Cross-test scores in Analysis in History/Social Studies and Analysis in Science, each on an 8-38 scale
- Question-level feedback showing which items you got right, wrong, or omitted
Reports are typically released roughly 6 to 8 weeks after the test date, per College Board's PSAT/NMSQT schedule. If your scores haven't appeared yet, our article on when PSAT scores come out explains the exact release windows for fall 2026 test dates.
You reach the report two ways. School-day testers usually see scores first inside the BigFuture School app on their phone. Everyone can log in at studentscores.collegeboard.org with the College Board account used at registration. Both show the same data, but the desktop portal gives you the cleaner view of subscores and question-level feedback.
Step 1: How to Access Your PSAT Score Report Online
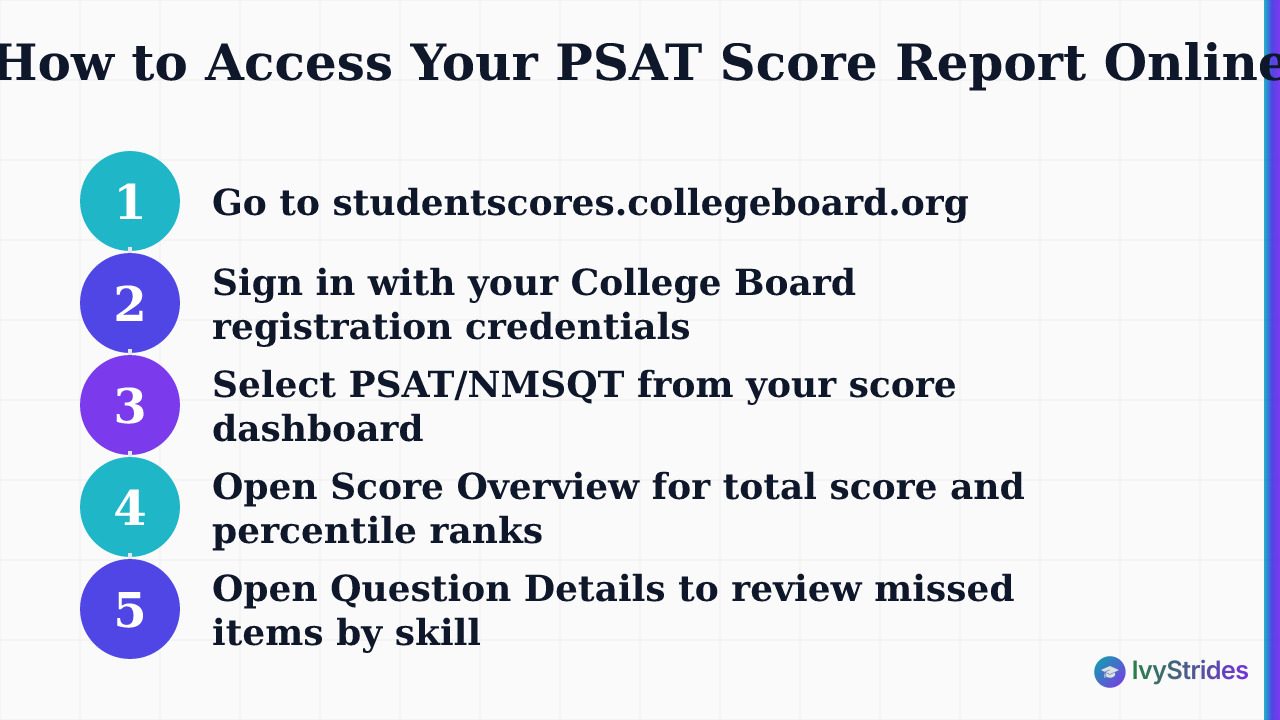
If you tested in school, check the BigFuture School app first. Scores tend to land there a few days ahead of the desktop portal. For the full report with subscores and question-level review, use the College Board site:
-
Go to studentscores.collegeboard.org.
-
Sign in with the College Board credentials you used at registration. If you can't remember the username, use "Forgot username" with the email on file.
-
Select PSAT/NMSQT from your score dashboard.
-
Open the Score Overview tab to see the total score, both section scores, and your percentile ranks.
-
Open the Question Details tab to see item-level performance, including which specific questions you missed and the skill each question tested.
-
Use the Skills Insight section or PDF download option to save a copy for your prep files.
Can't see scores at all? Confirm you're on the right account (families often create a duplicate), check the BigFuture School app, and confirm your school has released results. If nothing works, contact College Board support directly.
Bring the PDF to your first coaching session or use it to structure independent work with our PSAT practice tests, which mirror the question types in the Score Overview tab.
What Every Number on Your PSAT Score Report Actually Means
This is the layer most students skip. And it's where the diagnostic value lives.
Total Score (320-1520). The sum of your two section scores. That's it. It's a useful headline number and a rough SAT predictor, but it hides the skill gaps you actually need to fix.
Reading and Writing section score (160-760). Reflects performance across Craft and Structure, Information and Ideas, Standard English Conventions, and Expression of Ideas question types on the Digital SAT-aligned PSAT format.
Math section score (160-760). Reflects Algebra, Advanced Math, Problem-Solving and Data Analysis, and Geometry and Trigonometry.
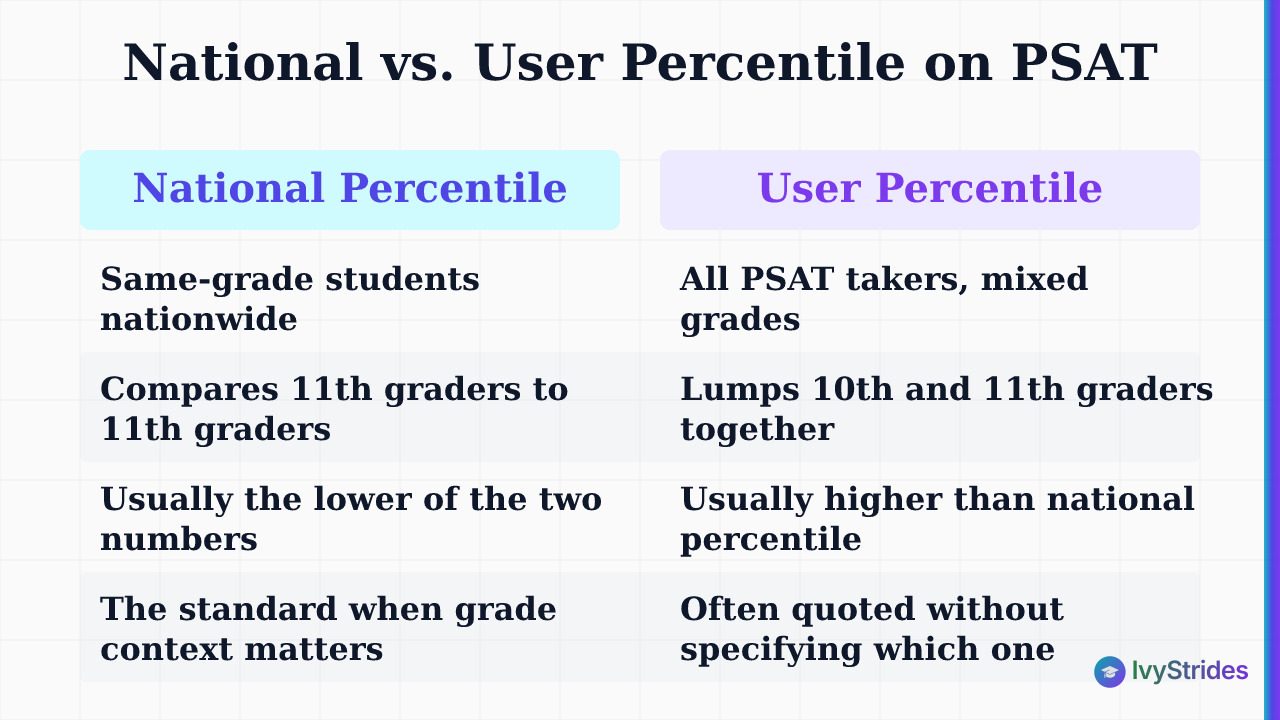
National percentile rank. The percentage of same-grade students nationwide who scored at or below your score. If you're an 11th grader at the 75th national percentile, roughly 75 percent of 11th graders scored at or below you.
User percentile rank. The percentage of all PSAT takers, mixed across grades, who scored at or below you. This number is usually higher than the national percentile because it lumps 10th and 11th graders together. When people quote a percentile without specifying which one, they almost always mean national.
Subscores (1-15). Seven skill-specific scores: Command of Evidence, Words in Context, Expression of Ideas, Standard English Conventions, Heart of Algebra, Problem Solving and Data Analysis, and Passport to Advanced Math. These are the real diagnostic gold.
Cross-test scores (8-38). Analysis in History/Social Studies and Analysis in Science. These pull questions from both the Reading and Writing section and the Math section that involve science or social-studies contexts.
Score band. A small range around each score indicating measurement precision. A total score of 1200 might carry a band of roughly 1170-1230, meaning if you retook a similar test tomorrow with no additional prep, you'd likely land somewhere in that range.
For the raw-to-scaled conversion behind these numbers, our companion guide on how the PSAT is scored walks through the full mechanics.
The Score That Confuses Everyone: How to Read the PSAT Selection Index
The Selection Index decides National Merit eligibility, and it trips up almost every 11th grader who sees it for the first time.
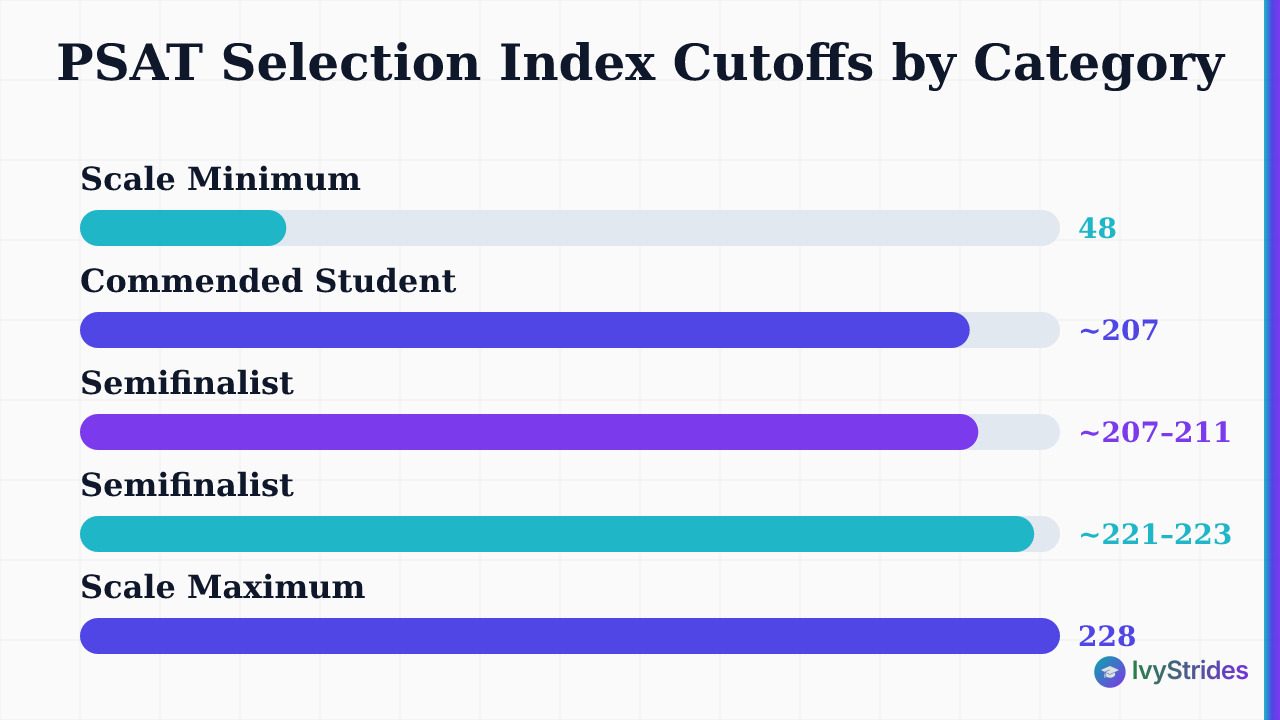
What it is. The Selection Index is derived from your two section scores, scaled to a range of 48 to 228. Loosely, you can think of it as Reading and Writing plus Math, divided by 10 and combined per the National Merit Scholarship Corporation's formula. The actual conversion is published by College Board each year.
Who it applies to. Only students who take the PSAT/NMSQT in 11th grade. The PSAT 10 and PSAT 8/9 don't count for National Merit, no matter how high the score.
The cutoffs. The National Merit Scholarship Corporation sets two thresholds each year:
- Commended Student is a single national cutoff, typically around a Selection Index of roughly 207. Reaching it puts you in roughly the top 3-4 percent of 11th-grade PSAT/NMSQT takers.
- Semifinalist is a state-specific cutoff and puts you in roughly the top 1 percent within your state. In lower-competition states (Wyoming, Montana, North Dakota, West Virginia) the cutoff typically sits around 207-211. In the most competitive states (California, New Jersey, Massachusetts, Maryland, Washington DC) it typically runs around 221-223.
A total score of roughly 1450 or higher generally corresponds to a Selection Index in the low 220s, which is competitive in most states but not always in the toughest ones. Cutoffs shift year to year, so verify the current-year figure with NMSC directly before making any decisions.
If your PSAT is high and you're weighing whether to prioritize National Merit prep or an SAT retake for admissions, our psat vs sat breakdown covers the trade-off.
PSAT Score Benchmarks: What Is a Good Score for Your Grade?
"Is my score good?" depends entirely on your grade. Here's the quick chart, drawn from College Board's published PSAT/NMSQT percentile data:
| Score Band | Approx. National Percentile (11th grade) | Label |
| 1450+ | Top 1% | National Merit competitive |
| 1270-1449 | Top 10% | Strong |
| 1150-1269 | Top 25-30% | Above average |
| 980-1149 | 50th percentile range | Average |
| Below 980 | Bottom half | Below average |
For 11th graders, the national average sits around 1010, top 10% starts around 1270, and top 1% starts around 1450.
For 10th graders, the average is roughly 960. So a sophomore scoring 1030 is above average, 1160 is excellent, and anything above 1270 is genuinely top-tier for the grade. Sophomores wondering whether their score is on track can find grade-specific benchmarks in our breakdown of good PSAT scores for 10th graders.
A common question: is a 1200 bad? No. A 1200 places an 11th grader roughly in the 70th to 75th national percentile, which is above average. It sits below the National Merit threshold in most states, but it's a strong platform for SAT prep, especially with roughly 4-6 months before your next test date.
For a full percentile table showing where your score sits relative to 10th and 11th graders nationally, see our deep-dive on the PSAT score range and percentiles.
How to Use Your Subscores to Find the Exact Skills Holding You Back
Look, this is the part most students miss. The total score tells you where you are. The subscores tell you what to do about it.
Every PSAT/NMSQT report shows seven subscores on a 1-15 scale.
Reading and Writing subscores:
- Command of Evidence (Can you point to the line in the passage that supports the claim?)
- Words in Context (Can you infer meaning from context and pick the precise word for a rhetorical purpose?)
- Expression of Ideas (Do you improve sentence-level clarity and paragraph organization?)
- Standard English Conventions (Grammar, punctuation, sentence structure)
Math subscores:
- Heart of Algebra (Linear equations, inequalities, systems)
- Problem Solving and Data Analysis (Ratios, percentages, graph reading, statistics)
- Passport to Advanced Math (Quadratics, exponentials, function manipulation)
Here's how to use them. Find your two lowest subscores. Those are your highest-use prep targets, because they carry the most points still on the table.
A student with 680 in Reading and Writing but only a 9 in Words in Context has a clear signal: vocabulary-in-context items are eating their Reading and Writing points. That student should prioritize context-driven vocabulary drilling before touching Command of Evidence. Similarly, a student with a Heart of Algebra subscore around 8 should hit linear equations and systems hard, because linear-equation items appear across both SAT Math modules and drive a disproportionate share of Math scoring.
In our coaching with students in the roughly 1000-1200 PSAT band, the most common pattern is a decent total score hiding one or two subscore gaps that account for the majority of the deficit. Addressing those two lowest subscores first typically produces the fastest total-score gains in the first 4-6 weeks of targeted work.
For subscore-targeted drilling, our PSAT practice tests sort questions by the same seven categories. To see how your subscores compare to grade-level averages, our guide to the average PSAT score has the full breakdown.
How to Turn Your PSAT Score Report Into an SAT Prep Plan
Here's the connection most families don't make: the PSAT and SAT sit on the same scale. Your PSAT total is a rough forecast of your SAT total without additional prep.
The projection rule of thumb. A 1200 PSAT typically predicts an SAT in roughly the 1150-1250 range if you take the test cold. A 1350 PSAT typically projects to around 1300-1400 cold. This is an estimate, not a promise. Actual SAT scores depend on how you prep, how the adaptive modules land, and test-day conditions. Our article on whether is the PSAT harder than the SAT covers the format differences that affect the projection.
The methodology that closes the gap. In our coaching, students who move from a PSAT score to a meaningfully higher SAT follow a four-step pattern:
-
Diagnostic practice test. Not the PSAT itself, but a full-length official SAT practice test to establish a real baseline on the adaptive digital format.
-
Subscore gap analysis. The lowest two subscores from the PSAT plus any new gaps that surface on the SAT diagnostic become the priority list.
-
Targeted weakness work with a section-specialist coach. SAT Reading and Writing has different rhythms than SAT Math. Students at higher score bands typically progress faster when the R&W coach and the Math coach are different people, each focused on their section.
-
Spaced retesting. A shorter practice test roughly every 2-3 weeks to track whether the targeted work is moving the needle, with the plan adjusted based on the data.
Realistic timelines. Most juniors have roughly 3-6 months between fall PSAT results and their first serious SAT sitting. For students completing our 1-on-1 SAT program during that window, typical gains from PSAT to SAT run around 100-200+ points, with the higher end more common for students starting in the roughly 1000-1250 band. Those gains reflect the diagnostic-led methodology above, not a guarantee.
A qualitative pattern from our coaching: students who plateau between weeks 4 and 6 are almost always repeating the same 2-3 error types on Math, most often mixing up linear-equation setups or missing units in Problem Solving and Data Analysis. Naming the error type explicitly is what breaks the plateau.
For a deeper look at score-band targets, our guide on what is a good PSAT score sets realistic goals by grade.
FAQ
Is the PSAT scored out of 1440 or 1520?
The PSAT/NMSQT is scored out of 1520, not 1440. The total ranges from 320 to 1520, combining a Reading and Writing section score of 160-760 and a Math section score of 160-760. The 1440 figure is outdated and refers to a pre-2015 format that no longer exists.
Is a 1200 a bad PSAT score?
A 1200 isn't a bad score. For an 11th grader it sits roughly in the 70th to 75th national percentile, which is above average. It falls below the National Merit Semifinalist threshold in most states, but it's a strong platform for SAT prep. For a sophomore, a 1200 is an excellent result.
What PSAT score puts you in the top 1%?
A total score around 1450 or higher generally puts a student in the top 1-2% of PSAT/NMSQT takers nationally, corresponding to a Selection Index roughly in the low 220s. That range is typically competitive for National Merit Semifinalist in most states, though the exact cutoff varies by state and year.
Does a 1470 PSAT score qualify for National Merit?
A 1470 is competitive for Semifinalist status in most states, especially lower-competition states where the Selection Index cutoff runs around 207-215. In the most competitive states (California, New Jersey, Massachusetts), cutoffs can reach around 221-223, and you may need a score closer to 1490-1510. Always verify the current year's state-specific cutoff with the National Merit Scholarship Corporation.
Why can I not see my PSAT score report online?
PSAT reports are typically released roughly 6-8 weeks after the test date. If the release window has passed and you still can't see scores, confirm you're logged into the correct College Board account (families often create a duplicate), check the BigFuture School app if you tested on a school day, and confirm your school has released results. If none of that works, contact College Board support directly.
What is a good PSAT score for a sophomore?
For a 10th grader, a score above 1030 is above average, above 1160 is excellent, and above 1270 places you in roughly the top 10% at grade level. Sophomores aren't eligible for National Merit (that requires the 11th-grade PSAT/NMSQT), so the more useful benchmark is how the score projects toward your SAT target for junior year. For a specific case like a 1280, see our post on is a 1280 a good PSAT score.
Your Next Step
Two low subscores, one prep plan, one test date on the calendar. That's the whole move. Students who name their weakest subscore within a week of getting results and start targeted work on it are the ones who see the biggest jump between PSAT and SAT.

Award-winning author (South Asian Book Award) and graduate of BITS Pilani and UCLA Luskin School of Public Affairs. Brings a published writer's eye to Common App essays and grammatical precision to SAT and ACT R&W instruction.