
Common Data Set Explained: The 5 Sections Applicants Should Read

On this page
- What the Common Data Set Is and Who Publishes It
- How to Find the Common Data Set for Any College
- The 5 Common Data Set Sections Every Applicant Should Read
- How to Use Common Data Set Data to Build a Balanced College List
- FAQ: Common Data Set Questions Applicants Ask
- What is a Common Data Set?
- How do I find a college's Common Data Set?
- Is the Common Data Set accurate?
- What is the Common Data Set 2025-2026?
- Your Next Step With the Common Data Set
The Common Data Set is a standardized annual questionnaire that colleges complete to report admissions, enrollment, test scores, financial aid, and student outcomes in one shared format. Any student can download a college's CDS as a free PDF from its institutional research office. Five sections carry the intelligence applicants actually need.
Those five are C, B, H, D, and F. This article shows you where to find any college's CDS and which numbers inside it tell you whether a school is a reach, target, or safety for your current score and budget.
What the Common Data Set Is and Who Publishes It
The Common Data Set is a shared reporting template that colleges fill out every academic year, organized into sections labeled A through J. Each college completes its own copy, so the numbers are self-reported but follow an identical structure across schools, which is what makes them comparable.
Where the template comes from. The Common Data Set Initiative, a collaborative effort among data providers including College Board, Peterson's, and U.S. News and World Report, publishes the blank template at commondataset.org. The goal is standardized, comparable institutional data, so a family can read Section C at one school and know exactly where the same figure sits at another.
Free, and updated yearly. Each college posts its CDS as a downloadable PDF through its institutional research office, at no cost. The current edition is 2025-2026, the cycle colleges completed to report data for that academic year. UCLA, Georgia Tech, Cornell, and USC have already published their 2025-2026 editions.
One caveat before you rely on any figure. The CDS reflects the prior academic year, so read it alongside the college's current admissions page for policy changes. If you want guided help turning that data into a plan, our college admissions counseling walks students through it.
| Section | Label | What It Reports |
| A | General Information | Contact, calendar, control |
| B | Enrollment and Persistence | Enrollment, retention, graduation rates |
| C | First-Year Admissions | Acceptance rate, factors, test scores |
| D | Transfer Admissions | Transfer requirements and counts |
| E | Academic Offerings | Majors, special programs |
| F | Student Life | Housing, activities, demographics |
| G | Annual Expenses | Tuition, fees, room and board |
| H | Financial Aid | Grants, need met, aid types |
| I | Instructional Faculty | Faculty counts, class sizes |
| J | Degrees Conferred | Degrees awarded by field |
How to Find the Common Data Set for Any College
You find a college's Common Data Set in one of two reliable ways: the college's own institutional research office page, or NCES College Navigator for the aggregated headline figures. The fastest route is a search for the exact phrase plus the school name.
The institutional research pattern. Most colleges post the CDS PDF on their institutional research office site. Harvard publishes through its office at ir.harvard.edu, Stanford through its office at irds.stanford.edu/data-findings/cds, and Columbia through its institutional research page. Search "Common Data Set Stanford" or "Common Data Set Columbia" and the top result is almost always the school's own PDF.
For federal figures without hunting through a PDF, NCES College Navigator aggregates CDS-derived data per institution: SAT and ACT 25th-to-75th percentile ranges, acceptance rate, enrollment, tuition, and graduation rate. It's handy when you want a quick read before downloading the full document.
If you have a rough list already, the next step is classifying each school as a reach, target, or safety. Our guide on reach, target, or safety classification applies CDS numbers to exactly that decision.
How to find any college's CDS in three steps:
-
Search "[College Name] Common Data Set" and open the institutional research office result.
-
Download the current PDF, confirming it reads 2025-2026, not an older edition.
-
Jump to Section C first; that is where admissions data lives.
The 5 Common Data Set Sections Every Applicant Should Read
Five Common Data Set sections carry the admissions intelligence that matters for an applicant: C, B, H, D, and F. Section C is the one you open first, because it reports the acceptance rate, the admissions factors table, and the score ranges of enrolled students.
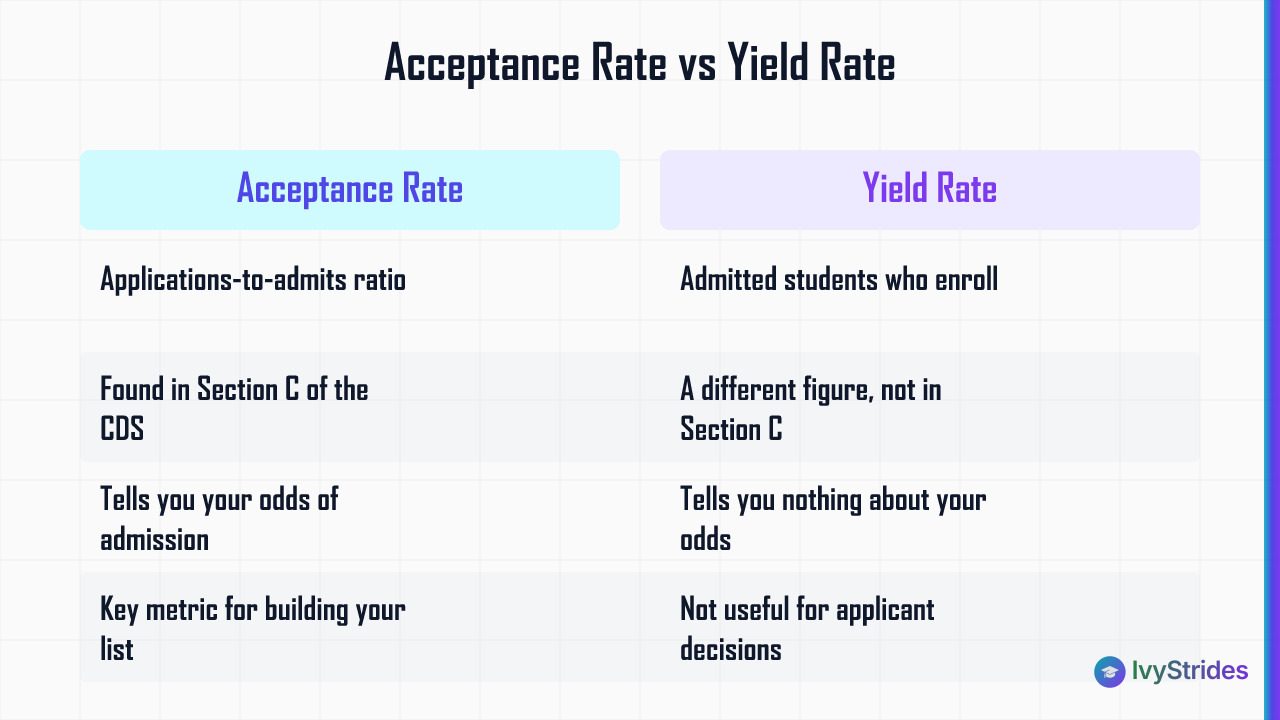
Section C, the core. The acceptance rate in Section C is applications-to-admits, not yield rate; yield is the share of admitted students who enroll, a different figure that tells you nothing about your odds. The admissions factors table ranks each component as Very Important, Important, Considered, or Not Considered. A school that marks rigor of secondary record Very Important and test scores Considered is telling you where to spend your energy.
Section C also lists the 25th-to-75th percentile SAT and ACT scores for enrolled students. That band is the number most applicants come to the CDS looking for, and once you have it you have the anchor for whether a school is a reach, target, or safety at your current score.
A score at or above the 75th percentile is strong on that metric. A score below the 25th makes the school a reach on scores alone, since the CDS publishes the 25th percentile as the point below which the bottom quarter of enrolled students scored, meaning roughly three-quarters scored higher (IvyStrides interprets the percentile positions the CDS reports). For what those levels mean in percentile terms, see SAT scores explained.
Two cautions on the score band. Section C also discloses whether a college is test-optional for the current cycle, but policies change year to year, so always check the most recent CDS edition rather than relying on a school's marketing page, and cross-check the FairTest tracker. Some colleges report superscored SAT figures in their CDS while others report single-sitting scores, so confirm the school's superscoring explained policy before setting your retake strategy.
| CDS Section | What to Look For | How to Use It |
| C | Acceptance rate, factors, 25th-75th scores | Set your score target and reach status |
| B | Enrollment, retention, graduation rate | Gauge class size and student success |
| H | Average grant, percent of need met | Compare real aid across schools |
| D | Transfer requirements, transfer admit rate | Assess a transfer pathway |
| F | Housing, activities, demographics | Judge campus fit |
In our college counseling work, students who pull Section C score ranges before finalizing their list avoid the common mistake of applying to schools where their SAT sits below the 25th percentile with no clear strategy for the rest of the application. The CDS gives you the benchmark. What it can't tell you is whether your score gap is closable before your application round.
How to Use Common Data Set Data to Build a Balanced College List
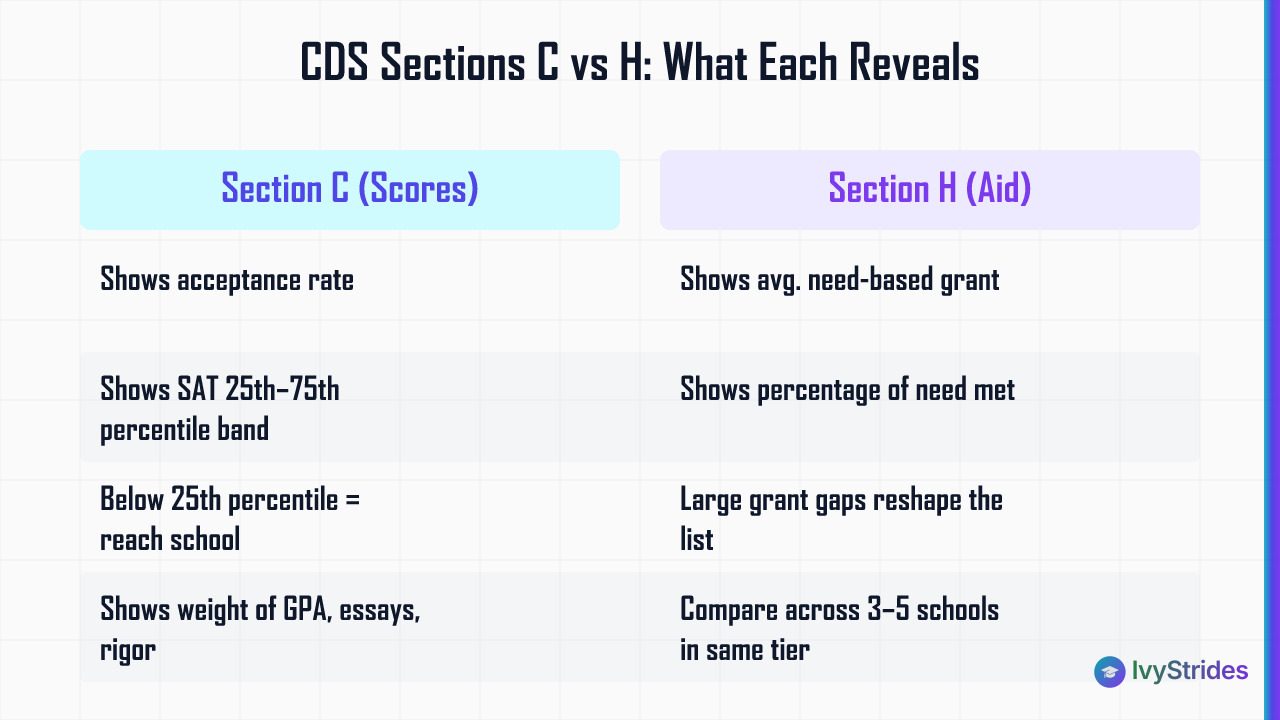
You build a balanced college list from Common Data Set numbers by lining up Section C score bands and Section H aid figures across two or three schools at a time, then sorting each into reach, target, or safety. A balanced college list is built from data, not reputation, and the CDS gives you the acceptance rate, score range, and aid picture for every school on your list in one place.
Score band, side by side. Take your own score to Section C for each school. If your SAT sits below a school's 25th percentile, that school reads as a reach on scores alone, regardless of the rest of your profile. Line up three schools and the reach, target, and safety split usually sorts itself out on paper before you have written a single essay.
Aid, side by side. Section H reports the average need-based grant and the percentage of need met. Families who compare Section H figures across three to five schools in the same selectivity tier routinely find a large annual gap in average grants that reshapes the list entirely. That gap is worth as much attention as any ranking.
| College | Acceptance Rate (C) | SAT 25th-75th (C) | Avg. Need Grant (H) |
| School A | Low | High band | Larger grant |
| School B | Mid | Mid band | Mid grant |
| School C | Higher | Lower band | Smaller grant |
Two caveats keep this honest. Admissions outcomes depend on the full application, not test scores alone; the factors table in Section C shows how much weight GPA, essays, and course rigor carry, and our guide on how colleges read your transcript covers that side. Section F of the CDS also lists academic offerings including AP credit policies, though those vary by school and the AP program's own credit tables remain the authoritative source. Once the list is set, our college application timeline maps when to lock it in.
Reading the CDS tells you the benchmark for every school. Whether your full profile, scores, GPA, essays, and rigor is competitive at each tier is the judgment call, and our college admissions counseling for grades 11 and 12 applies the same CDS data to your specific case.
FAQ: Common Data Set Questions Applicants Ask
What is a Common Data Set?
The Common Data Set is a standardized annual questionnaire that colleges complete to report admissions, enrollment, test scores, financial aid, and student outcomes in a shared format. Each college publishes it free as a PDF through its institutional research office. It's the most reliable public source of unfiltered admissions data, organized into sections A through J.
How do I find a college's Common Data Set?
Search "[College Name] Common Data Set" or "[College Name] institutional research CDS." Most colleges post a direct PDF link on their institutional research office page. NCES College Navigator also aggregates the key CDS figures, acceptance rate, score ranges, enrollment, for federal reporting if you want the headline numbers quickly.
Is the Common Data Set accurate?
The CDS is self-reported by colleges, but because it feeds major rankings and federal data systems, institutions have strong incentives to report accurately. The figures are as reliable as any public admissions data source. They reflect the prior academic year, though, so read them alongside the college's current admissions page for any policy changes.
What is the Common Data Set 2025-2026?
The 2025-2026 CDS is the edition colleges completed to report data for the 2025-2026 academic year. It's the most current edition and is available from each college's institutional research office. Institutions including UCLA, Georgia Tech, Cornell, and USC have published their 2025-2026 editions.
Your Next Step With the Common Data Set
The Common Data Set turns college research from reputation-guessing into data reading. You now know the document, where it lives, and the five sections that carry the intelligence for building a list and setting a score target.
Do this next:
- Download the CDS for two or three schools on your list, confirming the 2025-2026 edition.
- Open Section C and compare each 25th-to-75th percentile score band against your own score.
- Read Section H to compare average grants across schools in the same tier.
- Note any test-optional line in Section C, then verify it on the school's current admissions page.

Rajesh is a technology leader, entrepreneur, and angel investor with 28+ years in Business & Technology Leadership and Product & Solution Engineering. He is passionate about education, mentoring, and driving digital transformation.