PSAT Percentiles: How to Read Your Score by Grade and Plan Toward 1200+

On this page
- What PSAT Percentiles Actually Mean (and Why Two Numbers Appear on Your Report)
- PSAT Percentile Chart by Grade: 10th and 11th Grade Score Benchmarks
- What Counts as a Good PSAT Percentile at Each Grade Level
- The Selection Index and National Merit: What Score You Actually Need
- Not Sure If Your Score Can Reach National Merit Territory?
- What Percentile Is 1440 on the PSAT, and How the Top Score Bands Break Down
- How PSAT Prep Connects to Your SAT Score
- A Realistic Path to a 1200+ PSAT Score: What It Takes by Grade
- Frequently Asked Questions About PSAT Percentiles
- What is the top 1% PSAT score?
- Does a 1400 PSAT score qualify for National Merit?
- Is a 1240 PSAT score good for a junior?
- Do freshman PSAT percentiles matter for college admissions?
- What is the difference between User percentiles and Nationally Representative Sample percentiles on my score report?
- Ready to Turn Your PSAT Percentile Into a Real SAT Score?
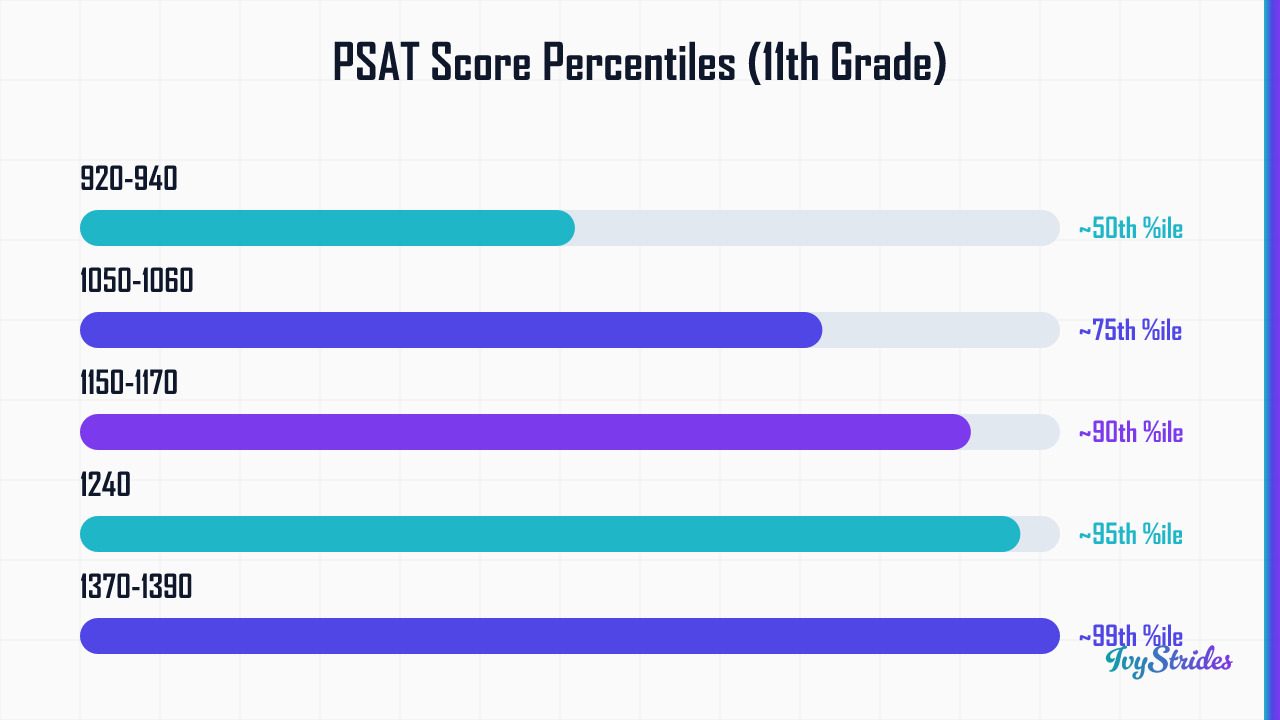
PSAT percentile ranks show what percentage of same-grade test-takers scored at or below your Total score on the 320-1520 scale. For 11th graders, roughly 920-940 sits at the 50th percentile, 1050-1060 reaches the 75th, 1150-1170 reaches the 90th, and 1370-1390 enters the 99th. Sophomores earn a higher percentile for the same raw score because the comparison group is younger. National Merit eligibility runs on a separate number called the Selection Index, not the Total score.
These figures come from College Board's User percentile tables at satsuite.collegeboard.org/psat-nmsqt, refreshed annually. The harder question is which percentile column to read, what the Selection Index means for your state, and how to convert any of this into a real prep plan. That's what the next sections cover.
What PSAT Percentiles Actually Mean (and Why Two Numbers Appear on Your Report)
A percentile rank of 75 typically means you scored at or above roughly 75% of same-grade test-takers, per College Board's PSAT/NMSQT scoring documentation. Simple in theory. The confusion starts when students open their score report and see two different percentile columns next to the same number.
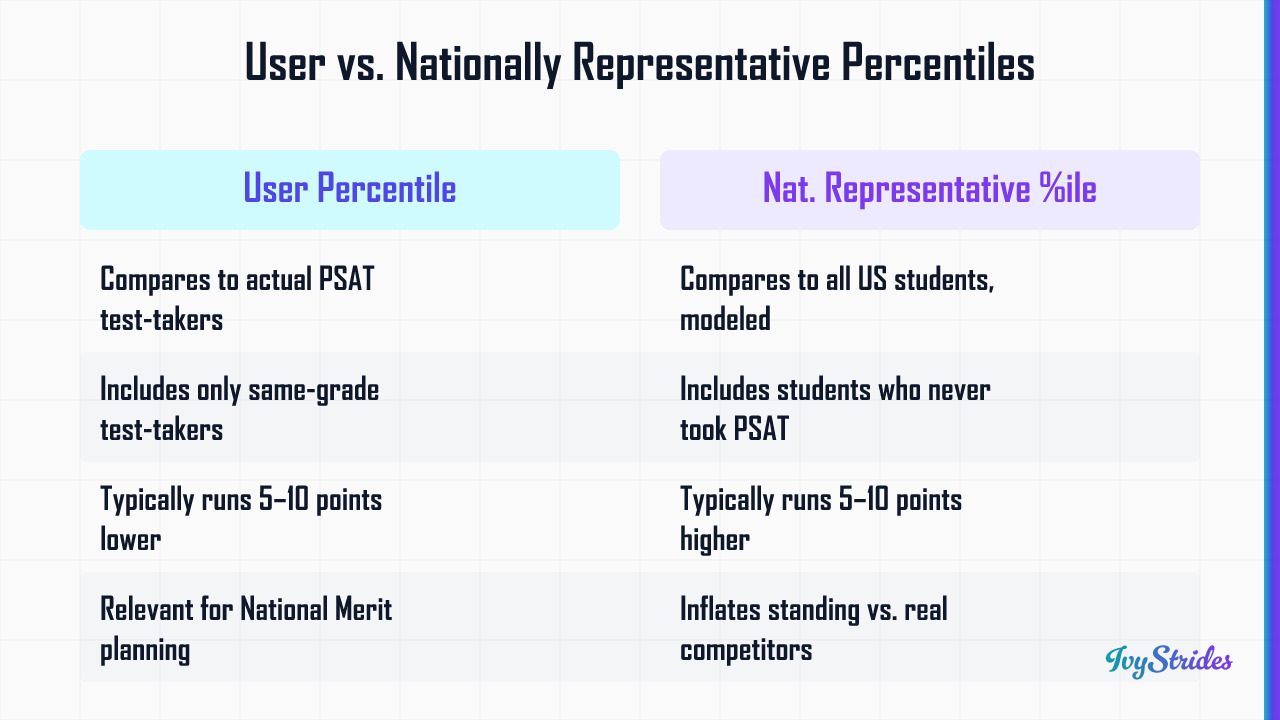
College Board publishes two reference populations. User percentiles compare your score to students who actually sat the PSAT in your grade. Nationally Representative Sample percentiles compare you to a modeled population of all US students at that grade level, including those who never took the test. Because PSAT test-takers skew higher-achieving than the general population, your User percentile will typically run lower than your Nationally Representative Sample percentile, roughly by 5-10 points.
Which one matters? User percentiles. They are the relevant benchmark for self-assessment, National Merit planning, and SAT readiness signaling. The Nationally Representative figure is useful background, but it inflates your standing relative to the students you'll actually compete with for college spots and scholarships.
Your score report also breaks percentiles down three ways: a Total score percentile on the 320-1520 scale, a Reading and Writing section score percentile (160-760), and a Math section score percentile (160-760). Each tells a different story. A student with a 1180 Total can have an 85th percentile R&W and a 70th percentile Math, which is a meaningful diagnostic signal about where to put prep hours. For more on interpreting the raw number itself, see what is a good PSAT score.
PSAT Percentile Chart by Grade: 10th and 11th Grade Score Benchmarks
Here are the working benchmarks from the current College Board User percentile tables. Treat these as approximate; exact figures shift slightly each year as the test-taking population changes.
Total score to percentile (11th grade PSAT/NMSQT, typical ranges per College Board User percentile tables):
- 920-940: roughly 50th percentile
- 1050-1060: roughly 75th percentile
- 1150-1170: roughly 90th percentile
- 1200-1220: roughly 92nd-93rd percentile
- 1240: roughly 95th percentile
- 1300-1320: roughly 97th-98th percentile
- 1370-1390: entry to 99th percentile
- 1440+: solidly 99th percentile
10th grade (PSAT 10 or PSAT/NMSQT sophomore sitting): the same raw score typically earns a noticeably higher percentile rank than in 11th grade, per College Board User percentile tables. A 1050 that lands at the 75th percentile for a junior sits closer to the 82nd-85th percentile for a sophomore. A 1150 that's roughly 90th percentile for juniors approaches the 93rd-94th percentile for sophomores.
Section score benchmarks for 11th grade typically run as follows per College Board section-score percentile tables:
- Math 680+: roughly 90th percentile
- Reading and Writing 680+: roughly 90th percentile
- Either section at 730+: roughly 99th percentile
For grade-specific deep dives, our breakdown of good PSAT scores for 10th graders walks through what each band means for SAT projection. Students who want to pressure-test these numbers should run a full-length PSAT practice tests under timed conditions.
One caveat. The College Board updates User percentile tables every year. Before quoting any specific cutoff to a counselor or scholarship committee, verify against the current-year table at satsuite.collegeboard.org/psat-nmsqt.
What Counts as a Good PSAT Percentile at Each Grade Level
The same percentile rank carries different weight depending on grade. Here's the honest read.
9th grade (PSAT 8/9). No score is "bad" at this stage. The 8/9 doesn't count for National Merit, doesn't appear on college applications, and exists almost entirely as a diagnostic, per College Board's PSAT 8/9 overview. Use the section breakdown to identify which content domain needs work before the high-stakes junior sitting. In our coaching, a freshman in the 50th percentile who starts targeted prep can typically reach the 90th by 11th grade.
10th grade. The real signal starts here. In our coaching with students at this band, a 75th percentile result (around 1050+) signals a solid SAT readiness trajectory. The 90th percentile (around 1130-1150) is genuinely strong and puts a Commended or Semifinalist run within reach with one more year of focused work. Below the 50th percentile in 10th grade isn't a crisis, but it's a flag that diagnostic work should start now, not in junior fall.
11th grade (PSAT/NMSQT). This is the only sitting that counts for National Merit, per the College Board PSAT/NMSQT program documentation. The 90th percentile (typically 1150-1170) is competitive in a college-application sense. The 95th percentile (around 1240) is roughly the threshold where National Merit Commended status becomes realistic in most years. To seriously contend for Semifinalist, you generally need 1300+ with a balanced section split, and even that depends entirely on your state's cutoff.
Honestly, the most common pattern we see is a junior who scores 1180-1240, assumes they're done, and misses that their R&W and Math are imbalanced enough to cost them 4-6 Selection Index points. That gap is the difference between Commended and Semifinalist in a high-cutoff state. For specific score-band reads, see our analysis of whether 1280 is a good PSAT score, and our take on whether 1050 is a good PSAT score for different grade levels.
In our coaching, students who score below the 75th percentile in 10th grade and begin a structured program typically close 100-150 points by their junior PSAT sitting.
The Selection Index and National Merit: What Score You Actually Need
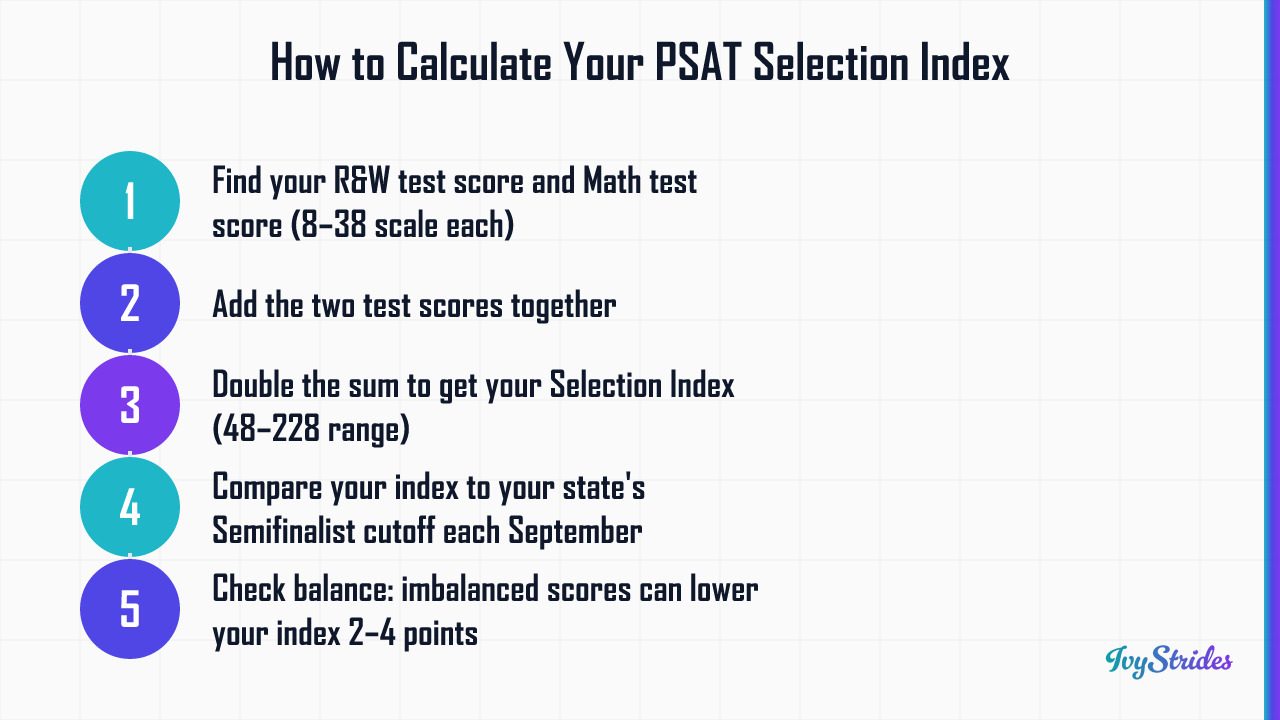
Your Selection Index, not your Total score alone, is the number that determines National Merit Semifinalist eligibility, and understanding how it's calculated from your section scores is the first step in building a targeted improvement plan.
Here's the formula. Take your Reading and Writing test score (on the 8-38 scale), add your Math test score (same 8-38 scale), then double the sum. The result is your Selection Index, scaled from 48 to 228. Important detail: the Selection Index uses the test scores on the 8-38 scale, not the 160-760 section scores that appear as your reported section totals. College Board displays the Selection Index directly on your score report, so you don't actually need to calculate it manually. If you're projecting from practice tests, this is the formula. Verify the mechanics on the current College Board PSAT/NMSQT page before relying on any projection.
The Commended Student threshold is a single national cutoff, typically in the range of Selection Index 207-209 in recent years. Roughly the top 50,000 scorers nationwide. Commended is real recognition but does not advance to Semifinalist.
Semifinalist cutoffs vary by state, released each September by the National Merit Scholarship Corporation. Recent ranges look like this:
- Highest-cutoff states (New Jersey, Massachusetts, California, DC, Maryland): typically 220-223
- Mid-tier states (Texas, Illinois, Florida, Virginia, Pennsylvania): typically 216-219
- Lower-cutoff states (Wyoming, North Dakota, West Virginia, Mississippi): typically 207-212
So: does a 1400 PSAT qualify for National Merit? Not automatically. In our coaching with juniors at this band, a 1400 Total with balanced section scores (around 700 R&W + 700 Math) typically yields a Selection Index of roughly 220, which clears Semifinalist in most states but may fall just short in the highest-cutoff states. An imbalanced 1400 (say 750 R&W + 650 Math) typically yields a slightly lower Selection Index, roughly 2-4 points lower, which can flip a Semifinalist into a Commended.
Here's the part most students miss. Section balance matters as much as Total score. A parent recently asked us about her son's 1390 with a 740 R&W and a 650 Math; the imbalance pulled his Selection Index two points under his state's cutoff even though the Total looked competitive. Only the 11th-grade PSAT/NMSQT counts for National Merit. Freshman and sophomore scores have zero direct National Merit consequence. For more on how PSAT results forecast SAT readiness, see our piece on psat results and SAT success.
Not Sure If Your Score Can Reach National Merit Territory?
Book a free 15-minute strategy call. We'll review your score report, calculate your Selection Index, compare it against your state's cutoff, and tell you exactly how many points you need and how long it will realistically take. Students and parents are both welcome on the call.
What Percentile Is 1440 on the PSAT, and How the Top Score Bands Break Down
A 1440 PSAT Total score for an 11th grader typically sits at or above the 99th percentile on User percentiles, per College Board's User percentile tables. Roughly top 1% nationally.
Here's the full breakdown of the upper bands for juniors:
Upper-band totals for juniors typically map as follows, per College Board's PSAT/NMSQT percentile tables:
- 1200-1220: roughly 92nd-93rd percentile. Competitive for Commended in lower-cutoff states.
- 1240: roughly 95th percentile. Commended threshold in most years.
- 1300-1320: roughly 97th-98th percentile. Commended secure; Semifinalist competitive in mid-tier states.
- 1370-1390: entry to 99th percentile. Semifinalist competitive in nearly every state.
- 1440+: solidly 99th percentile. Semifinalist comfortable in all states assuming balanced sections.
- 1520: the maximum possible PSAT score.
That last point trips up a lot of students. The PSAT ceiling is 1520, not 1600. The SAT goes to 1600 because each section maxes at 800. The PSAT sections cap at 760 each, which is why your highest possible Total is 1520. If a tutor or counselor tells you to "aim for a 1600 on the PSAT," they don't know what they're talking about. For the format mechanics behind this difference, see the difference between SAT and PSAT.
Always verify the current-year top-band percentile mappings against College Board's PSAT/NMSQT percentile tables before quoting them to a scholarship application.
How PSAT Prep Connects to Your SAT Score
Because the PSAT and the Digital SAT share the same adaptive two-module structure and the same question types, the prep work you do to raise your PSAT score is also building your SAT foundation.
Both tests use a two-module adaptive design per section. Module 1 sets a fixed mix of easier and harder questions; Module 2 adapts up or down based on Module 1 performance. The question types are functionally identical: Information and Ideas, Craft and Structure, Expression of Ideas, and Standard English Conventions on the Reading and Writing side; Algebra, Advanced Math, Problem-Solving and Data Analysis, and Geometry/Trigonometry on the Math side. Pacing rules, calculator policy (built-in Desmos for all Math), and time per module are the same. Format details are documented at satsuite.collegeboard.org.
So how does a PSAT score project to an SAT score? A PSAT Total of 1200 projects to an SAT range of roughly 1200-1280, depending on what prep happens between sittings. There's no automatic 80-point bump for taking the SAT, despite what some forum posts claim. The score you earn on test day reflects your actual preparation level, not the test's name.
In our coaching with students who finish a 10th-grade PSAT in the 1050-1150 range and complete a structured diagnostic-driven program, a typical SAT result lands in the 1200-1350 band within 3-5 months. The methodology stays consistent: a full-length diagnostic, section-by-section weakness identification, targeted skill work with a section-specialist coach (Math and R&W coached separately, by different specialists), and spaced retesting to verify retention.
For students wondering about test difficulty comparison, our piece on is the PSAT harder than the SAT addresses the common misconception. The technical side of scoring is covered in how the Digital SAT is scored.
A Realistic Path to a 1200+ PSAT Score: What It Takes by Grade
Let's get concrete. A 1200+ PSAT for an 11th grader is roughly the 92nd-93rd percentile. Solid Commended territory in most years, and the platform from which a Semifinalist run becomes realistic with another 50-100 points of work.
If you're currently in the 900-1000 range (~50th-65th percentile). You need 200-300 points to reach 1200+. In our coaching with students at this band, that gain typically takes 3-5 months of structured prep at 6-10 hours per week, with the heavier hours falling on the weaker section. That's roughly 80-150 total study hours across the program. Most students at this band have a content gap, not a strategy gap; they need to actually master Advanced Math units (quadratics, exponents, function notation) or R&W craft questions (rhetorical synthesis, transitions) before timing strategy matters.
If you're currently in the 1050-1150 range (~75th-88th percentile). You need 50-150 points. This is achievable in 6-12 weeks with targeted section work. At this band the bottleneck shifts from content to pacing and accuracy on Module 2 hard questions. The diagnostic typically shows a 30-50 point gap on one section that, once closed, lifts the Total over 1200.
If you're a sophomore. Hitting 1200+ on your 10th-grade PSAT typically puts you above the 90th percentile for your grade per College Board User percentile tables and signals genuinely strong SAT readiness. More importantly, it's the launchpad for a Selection Index run as a junior. The students we coach who clear National Merit Semifinalist almost all hit 1180+ in sophomore year.
If you're a junior targeting National Merit. From a 1200 baseline, reaching a Selection Index of 215+ requires section scores averaging approximately 680-690 each. The path is rarely about both sections improving equally. It's about identifying the weaker section (usually 30-50 points behind the stronger one) and closing that gap with a section-specialist coach. For a sense of who actually teaches at this level, meet our tutors.
Every IvyStrides plan starts with a full-length diagnostic PSAT practice tests, not a placement quiz. You can't build a real plan without seeing how a student performs on a current-format adaptive test under timed conditions.
Frequently Asked Questions About PSAT Percentiles
What is the top 1% PSAT score?
For 11th graders, the top 1% (roughly the 99th percentile) typically begins at approximately 1370-1390 on the 320-1520 scale, based on User percentiles published by College Board. A score of 1440 or above is solidly within the 99th percentile. Exact cutoffs shift slightly each year as the test-taking population changes, so check the current-year College Board percentile tables for the most precise figure.
Does a 1400 PSAT score qualify for National Merit?
Not automatically. National Merit eligibility is determined by the Selection Index, not the Total score alone, and the Semifinalist cutoff varies by state. A 1400 Total with balanced section scores yields a Selection Index of approximately 220, which is competitive in most states but may fall short in high-cutoff states like New Jersey or Massachusetts where the bar can reach 221-223. Check your state's published cutoff each September on the College Board PSAT/NMSQT page.
Is a 1240 PSAT score good for a junior?
Yes. A 1240 for an 11th grader is approximately the 95th percentile on User percentiles, which is a strong result. It places the student in Commended Student range in most years and within striking distance of Semifinalist status in many states. Whether it reaches the Semifinalist cutoff depends entirely on the student's state; students in highly competitive states may need another 20-40 points on the Selection Index, which usually means raising the weaker section.
Do freshman PSAT percentiles matter for college admissions?
No. Freshman PSAT scores, taken on the PSAT 8/9, have zero impact on college admissions and don't count toward National Merit. Their value is purely diagnostic: they show which sections need the most work before the high-stakes 11th-grade PSAT/NMSQT sitting. Treat a freshman score as a baseline reading, not a verdict on the student's future.
What is the difference between User percentiles and Nationally Representative Sample percentiles on my score report?
User percentiles compare your score to actual PSAT test-takers in your grade. Nationally Representative Sample percentiles compare your score to a modeled population designed to represent all US students at that grade level, including those who didn't take the PSAT. User percentiles are lower (because PSAT test-takers skew higher-achieving than the general population) and are the more relevant benchmark for self-assessment, National Merit planning, and college-readiness signaling. For more comparative context, see psat vs sat difficulty.
Your PSAT score report holds more decisions than most students realize. The Total score is the headline; the Selection Index is the verdict; the section split is the strategy. Read all three, and you'll know exactly what to do next.
Ready to Turn Your PSAT Percentile Into a Real SAT Score?
Every IvyStrides PSAT plan starts with a full-length diagnostic test, not a guess. In 15 minutes, we can show you exactly where your score stands, what your Selection Index means for your state, and what a realistic path to 1200+ looks like for your timeline. Students and parents are both welcome on the call.

Award-winning author (South Asian Book Award) and graduate of BITS Pilani and UCLA Luskin School of Public Affairs. Brings a published writer's eye to Common App essays and grammatical precision to SAT and ACT R&W instruction.