
What's a Good PSAT Score in 2026? Percentiles by Grade and the 320-1520 Scale
On this page
- The Quick Answer: What Counts as a Good PSAT Score?
- How the PSAT Is Scored: The 320-1520 Scale Explained
- PSAT Score Benchmarks by Grade: Freshman Through Junior
- I Just Got My Score Back. Is It Actually Good?
- The National Merit Pathway: What PSAT Score Do You Actually Need?
- What Is a Good PSAT Score for Selective and Ivy-Caliber Colleges?
- What to Do After You See Your Score: Turning a PSAT Result into a SAT Plan
- FAQ
- Is a 950 a good PSAT score?
- What PSAT score puts a student in the top 1%?
- Do colleges see PSAT scores when reviewing applications?
- Is a 1200 on the PSAT a good score?
- What is a good PSAT score for an 8th grader?
- What is a good PSAT score for a sophomore?
A good PSAT score sits at or above the 75th percentile, which lands around 1160-1180 on the 320-1520 composite scale for 10th and 11th graders. Juniors chasing National Merit Semifinalist status typically need a composite around 1400 or higher, though state-specific Selection Index cutoffs for the Class of 2027 run roughly 208 to 223. Grade matters here: a 950 is above average for a 9th grader, close to average for a sophomore, and below average for a junior.
Those score bands come from College Board's official PSAT/NMSQT percentile data, with National Merit projections announced officially by the National Merit Scholarship Corporation each September. The harder question is what your score signals about your SAT trajectory and which section to attack first. That's what the rest of this piece walks through.

The Quick Answer: What Counts as a Good PSAT Score?
The PSAT/NMSQT is scored on a 320 to 1520 composite scale, not the 400-1600 SAT scale. Two sections each contribute 160-760: the Reading and Writing section and the Math section. Add them and you get your composite.
Around the 75th percentile, roughly 1160-1180 puts you above three out of four test-takers nationally. That's the threshold most coaches, including ours, treat as "good." At the 90th percentile you're around 1280 or higher. The 99th percentile, the top-1% ceiling, lands between about 1420 and the maximum 1520 depending on grade level.
Why does the PSAT top out at 1520 and not 1600? The test is calibrated for a slightly narrower difficulty band than the SAT. The hardest PSAT questions aren't quite as hard as the hardest SAT questions, so the ceiling reflects that. Same scale, lower cap. For a deeper comparison of the two tests, see our breakdown of the psat score range.
How the PSAT Is Scored: The 320-1520 Scale Explained
Each of the two sections, Reading and Writing and Math, is scored 160 to 760. Add them and you get your composite. Simple math. Three structural details are worth understanding before you interpret your own score.
The test is digital and adaptive. Each section splits into two modules. Module 1 is a mixed-difficulty set. Your performance on Module 1 determines whether Module 2 is easier or harder. Route into the harder Module 2 and your score ceiling is high; route into the easier one and your ceiling caps well below 760 in that section. This is the same adaptive structure the Digital SAT uses. The PSAT and SAT share the same SAT Suite of Assessments scale, so your PSAT composite is a legitimate predictor of a starting SAT range.
The Selection Index is separate from your composite. For National Merit purposes, the National Merit Scholarship Corporation converts your Digital PSAT section scores into a Selection Index scaled up to 228. This is the number that determines Semifinalist eligibility, not your composite. More on that below.
PSAT and SAT differ in ceiling but not in content. The question types, passage lengths, math domains, and pacing pressure all mirror the SAT. If you want the granular contrast, our post on the difference between SAT and PSAT covers it. The PSAT's lower score ceiling reflects a slightly narrower difficulty range, not a different test in any meaningful sense.
PSAT Score Benchmarks by Grade: Freshman Through Junior
Here's the part most students misread. A composite that's excellent for a freshman is only average for a junior, because the comparison group changes. Below are the benchmarks we use in coaching, drawn from College Board percentile tables for the current Digital PSAT.
| Grade | Average (~50th) | Good (75th) | Excellent (90th) | Top 1% (99th) |
| 8th (PSAT 8/9)\* | roughly 850-920 | 1000+ | 1100+ | 1200+ |
| 9th (freshman) | roughly 920-970 | 1010-1030 | 1150+ | 1300-1350 |
| 10th (sophomore) | roughly 990-1020 | 1080-1100 | 1200-1250 | 1420-1520 |
| 11th (junior) | roughly 1010-1040 | 1150-1180 | 1280+ | 1420-1520 |
\*Important distinction: 8th and most 9th graders take the PSAT 8/9, a separate test on a 240-1440 scale, not the PSAT/NMSQT (320-1520). Percentiles above for 8th grade are for PSAT 8/9. Some 9th graders take PSAT/NMSQT, but most take PSAT 8/9. Don't compare across the two scales; they use different comparison groups.
Sophomores, the score to beat is 1080 for "good" and 1200 for "excellent." Our full breakdown of good PSAT scores for 10th graders goes deeper into how the sophomore score should shape junior year prep. To benchmark yourself against timed practice, our PSAT practice tests library gives you full-length diagnostics under real conditions.
One pattern worth flagging: the most common gap we see in coaching is a roughly 60-80 point Math deficit relative to Reading and Writing. If your section scores show that shape, your prep priority is obvious.
I Just Got My Score Back. Is It Actually Good?
Let's walk through the exact score bands students actually get, and what each one means at each grade.
850-950. Above average for a 9th grader, roughly average for a sophomore, below average for a junior. Freshmen have a long runway to junior year. For juniors, this is a clear signal that focused prep is needed if you're targeting selective colleges or a strong SAT.
950-1080. Squarely average for sophomores and juniors. Not a red flag, not competitive for highly selective colleges either. This is the largest cohort of test-takers.
1080-1200. Good for a sophomore (around the 75th to 85th percentile), approaching average-to-slightly-above for a junior. Predicts a starting SAT in roughly the same range before any prep.
1200-1350. Strong for a sophomore (approaching roughly the 90th percentile), good for a junior. A 1200 predicts a starting SAT around 1200-1250; a 1300 predicts around 1300-1350. Meaningful room to grow with targeted work.
A 1280 specifically lands around the 90th percentile for juniors and signals SAT readiness in the 1300-1400 band. We cover this exact question in more depth in is 1280 a good PSAT score.
1350-1420. Excellent. Approaching National Merit range in lower-cutoff states. Predicts an SAT starting point in roughly the 1350-1450 band.
1420-1520. Top 1%. National Merit Semifinalist contender in most or all states, though state cutoffs vary. This is the range where students targeting Ivy-caliber schools want to land by junior fall.
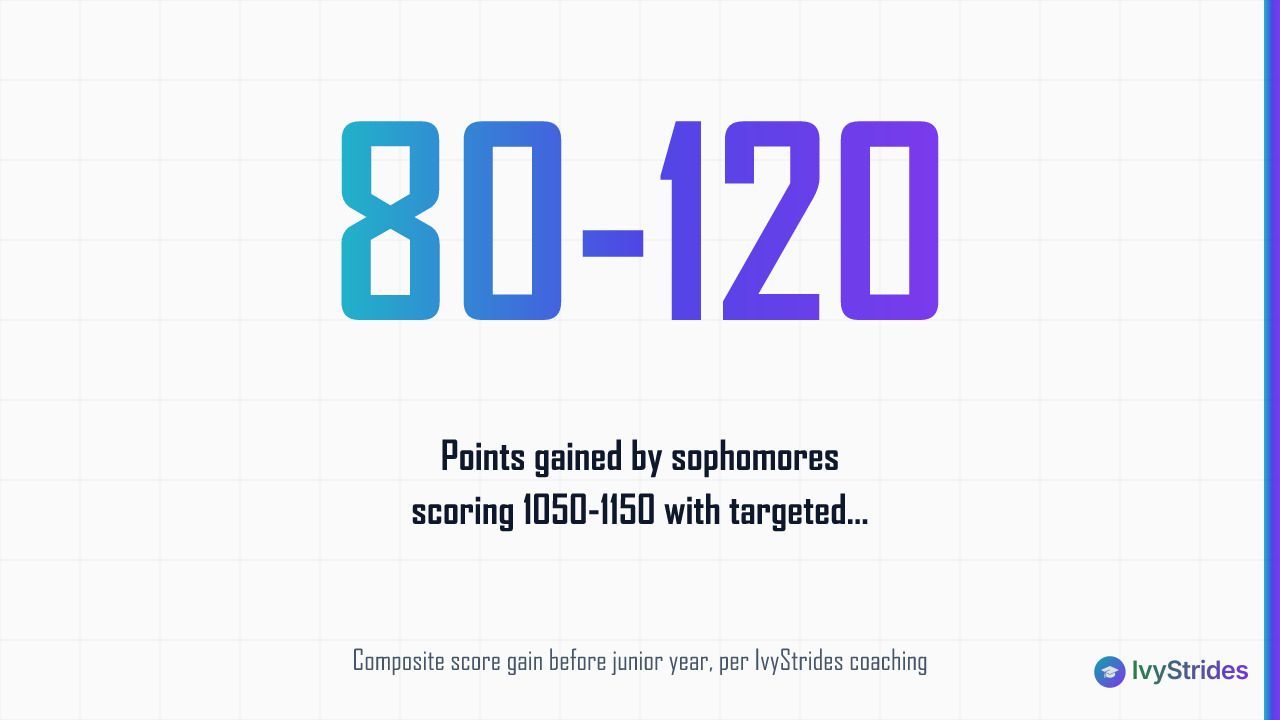
In our coaching with students scoring 1050-1150 as sophomores, targeted work on the weaker section typically moves the composite roughly 80-120 points before junior year. That gain comes from diagnostic-led section work, not from generic practice-test volume. Students who plateau are usually the ones drilling full-length tests without ever isolating the specific question types they miss.
For a fuller picture of how PSAT scores predict SAT readiness, see PSAT results and SAT readiness.
The National Merit Pathway: What PSAT Score Do You Actually Need?
Only junior-year (11th grade) PSAT/NMSQT scores count for National Merit. Sophomore scores, no matter how high, don't qualify. This is the single most misunderstood rule in the entire PSAT ecosystem.
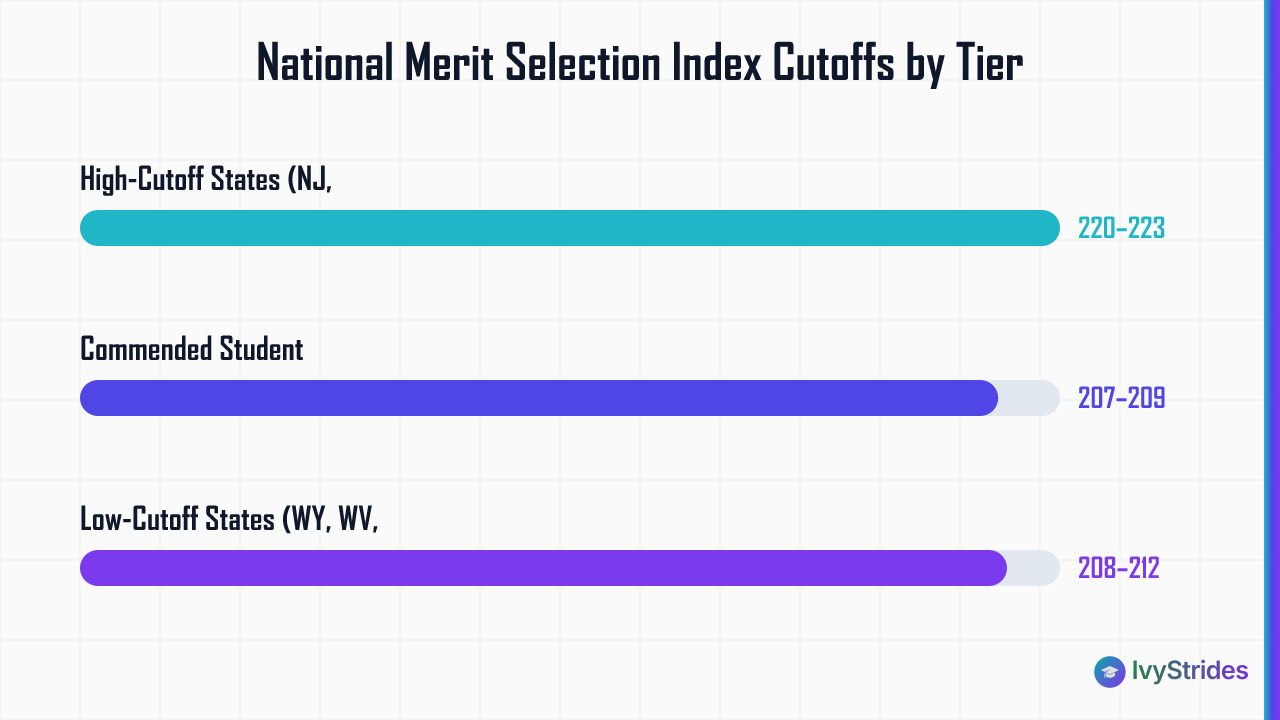
The National Merit Scholarship Corporation calculates a Selection Index from your section scores, scaled up to a maximum of 228. Semifinalist status is determined state by state: each state has its own cutoff, and roughly the top 1% of juniors in each state qualify. For the Class of 2027, projected Semifinalist cutoffs run from approximately 208 to 223 depending on state, based on recent published state-cutoff trends.
High-cutoff states (New Jersey, Massachusetts, Washington DC, parts of California) typically require a Selection Index around 220-223. Lower-cutoff states (parts of the Midwest, Wyoming, West Virginia) often fall around 208-212. A composite of 1400 on the Digital PSAT corresponds roughly to a Selection Index of 210-212, which clears the bar in many but not all states.
Below the state Semifinalist cutoff sits the Commended Student threshold, a single national cutoff typically around 207-209 (set below the lowest state Semifinalist cutoff). Commended Students receive recognition but don't advance to Finalist status or the national scholarship competition.
A caveat that matters: cutoffs change every year and are only official once NMSC announces them, usually the September after the junior-year test. The 208-223 range above is a projection, not a final number. If National Merit is a real goal for your family, verify current-year cutoffs against NMSC's official announcement before making prep decisions.
A 1400 doesn't "qualify" you for anything on its own. It puts you in the running in most states. To lock in Semifinalist status in a high-cutoff state, juniors typically need a composite in the 1450-1520 range. Our guide on how to study for the PSAT covers the timeline and section priorities for students specifically pursuing this pathway.
What Is a Good PSAT Score for Selective and Ivy-Caliber Colleges?
Here's the part most families miss: colleges don't receive PSAT scores. They don't use PSAT scores in admissions decisions. The PSAT exists to help you practice, to identify National Merit candidates, and to give you a diagnostic. Nothing more.
So the real question isn't "what PSAT score do I need for Harvard?" It's what your PSAT signals about the SAT score you'll actually submit.
Selective colleges publish middle-50% SAT ranges in their Common Data Set. Harvard's middle-50% SAT lands around 1500-1580 based on recent Common Data Set filings. Yale, Princeton, MIT, Stanford, and Columbia sit in similar territory. Duke, Northwestern, and Chicago run roughly 1490-1570. Cornell and Penn run slightly wider. To land in these ranges, students typically need a junior-year PSAT in the 1420-1520 band as a starting point, then hold or lift that score into SAT territory.
A strong PSAT score, combined with a rigorous AP course load, signals academic readiness to selective colleges even before SAT scores are submitted. Our ap courses online program pairs naturally with PSAT/SAT prep for students building a competitive junior-year academic profile. If Cornell specifically is on your list, we've written a full playbook: Apply to Cornell University in 2026: What You Must Know.
In our coaching with students targeting Ivy-caliber schools who score below 1350 on the junior PSAT, a typical prep runway to reach a competitive SAT range is about 12-20 weeks of section-targeted work, roughly 6-10 hours per week.
Two caveats to hold on to. Test-optional policies vary by school and by year; the FairTest tracker is the fastest way to check current policy at a specific school. Test scores are also one piece of a full application. GPA, course rigor, essays, and recommendations carry substantial weight, especially at highly selective schools.
What to Do After You See Your Score: Turning a PSAT Result into a SAT Plan

Photo by cottonbro studio on Pexels
Once you know where your score sits relative to these benchmarks, a structured PSAT study plan can close the gap before your next test date. Here's how to think about the next about 8 to 16 weeks.
Step 1: Look at the section gap, not just the composite. Your PSAT score report breaks out Reading and Writing and Math separately. Whichever section is lower is your priority. In our coaching, students who use their PSAT diagnostic to identify weak sections, then work with a section-specialist coach on those exact skills, typically see the largest SAT score gains. A generalist tutor covering both R&W and Math won't match the depth of a coach who does one section, all day, every day.
Step 2: Convert your PSAT into an SAT starting range. Your PSAT composite maps directly onto the SAT scale, so the section where you lost the most points on the PSAT is the section to attack first in SAT prep. A junior-year PSAT of 1150 typically predicts an SAT starting range of roughly 1150-1200 before prep. Our full PSAT to SAT score conversion breakdown walks through the exact mapping.
Step 3: Build a diagnostic-first plan. Every serious prep plan starts from a real, timed, full-length practice test, not from a chapter-by-chapter textbook. The diagnostic tells you which of the four SAT R&W content domains (Information and Ideas, Craft and Structure, Expression of Ideas, Standard English Conventions) and which of the four Math domains (Algebra, Advanced Math, Problem-Solving and Data Analysis, Geometry and Trigonometry) are actually costing you points. You can pull a full-length diagnostic from our PSAT practice tests library.
Step 4: Know your next test date. Knowing your target score is only useful if you also know when the next PSAT is offered and how much prep time you have before it. Registration windows and testing dates are covered in our PSAT test dates 2026 breakdown.
Step 5: Set a realistic timeline. In our coaching, students who complete a full diagnostic and roughly 10-14 weeks of targeted section work typically see SAT composite gains of 200 points or more from their PSAT baseline. Students working from lower starting scores (below 1150) often see gains toward the higher end of that range, though the exact delta depends on hours per week, retention between sessions, and honest engagement with homework.
FAQ
Is a 950 a good PSAT score?
A 950 is above average for a 9th grader (freshman), close to average for a sophomore, and below average for a junior. Context is everything. For a freshman, a 950 is a reasonable starting point with a long runway to junior year. For a junior, a 950 signals that focused prep is needed before the SAT if you're targeting competitive colleges. Use the grade-level table above to interpret your specific situation.
What PSAT score puts a student in the top 1%?
For 10th and 11th graders, a composite of approximately 1420-1520 places a student around the 99th percentile. For 9th graders taking the PSAT/NMSQT, the top 1% threshold is lower, roughly 1300-1350, because the comparison group is younger and less prepared. Note that 8th graders take the PSAT 8/9, which uses a different scale (240-1440) and different percentile tables.
Do colleges see PSAT scores when reviewing applications?
No. Colleges don't receive PSAT scores and don't use them in admissions decisions. The PSAT serves two purposes: practice for the SAT, and identification of National Merit Scholarship candidates. Your SAT or ACT score, GPA, course rigor, essays, and recommendations are what colleges evaluate.
Is a 1200 on the PSAT a good score?
A 1200 is above average at every grade level. For a sophomore, it's a strong score, roughly the 85th to 90th percentile. For a junior, it falls around the 75th to 80th percentile: good, but not yet in National Merit range. A 1200 PSAT predicts a starting SAT range of about 1200-1250, which leaves meaningful room for growth with targeted prep.
What is a good PSAT score for an 8th grader?
8th graders take the PSAT 8/9, which uses a 240-1440 scale, not the PSAT/NMSQT 320-1520 scale. A score of 1000 or above is generally considered strong for an 8th grader. Since colleges never see PSAT 8/9 scores, the value is purely diagnostic: it tells you which skills to build before serious SAT prep begins in 10th or 11th grade.
What is a good PSAT score for a sophomore?
For a 10th grader, a score at or above the 75th percentile (roughly 1080-1100) is considered good. A 1200 or higher is excellent for a sophomore and signals strong SAT readiness. Sophomores aren't eligible for National Merit (only junior-year scores count), so the primary use of a sophomore PSAT is as a diagnostic to shape a specific SAT prep plan for junior year.
Whatever your composite, the score is only as useful as what you do with it. Section gap analysis, targeted weakness work, and a realistic timeline turn a PSAT result into an SAT score you'd actually submit. If you'd like a coach to look at your specific score report and tell you exactly which section to attack first, our tutors team is where to start. For how we approach score-band coaching, see about IvyStrides.

Award-winning author (South Asian Book Award) and graduate of BITS Pilani and UCLA Luskin School of Public Affairs. Brings a published writer's eye to Common App essays and grammatical precision to SAT and ACT R&W instruction.