
How to Use your PSAT Score to Set an SAT Goal: The Complete 2026 Playbook for a Top Score
On this page
- What Your PSAT Score Actually Tells You (And What It Does Not)
- Translating Your PSAT Score into a Projected SAT Range
- How to Find the SAT Score You Actually Need for Your Target Colleges
- The Section Gap Analysis: Where Your SAT Points Are Actually Hiding
- Score-Band Playbooks: What to Do Based on Where You Are Right Now
- Building Your SAT Prep Timeline from Your PSAT Baseline
- A Special Case: When Your PSAT Score Also Matters for National Merit
- From PSAT Gap to SAT Plan: The Four-Step IvyStrides Methodology
- FAQ
- How accurate is the PSAT as a predictor of my SAT score?
- I got a 1170 on the PSAT and a 1300 on the SAT. Why is there such a big gap?
- How many times should I take the SAT if I want to improve from my PSAT baseline?
- Does my PSAT score matter for college admissions directly?
- What if my PSAT score is already above my SAT target range?
- Is free PSAT prep enough to make National Merit?
- Your Next Step
To use your PSAT score to set an SAT goal, add roughly 20 to 40 points to your PSAT composite (320 to 1520 scale) to get a projected SAT range on the 400 to 1600 scale, since the two tests share the same design but the SAT is slightly more demanding. Then pull the 25th and 75th percentile SAT scores at your target colleges from their Common Data Set. The gap between your projected SAT and the 75th percentile at your reach schools is your improvement target. Break that gap into section-level goals using your PSAT Reading and Writing and Math scores separately.
Those numbers come from College Board's Digital SAT documentation and the PSAT/NMSQT program page. The harder question isn't the projection itself; it's what to do with the gap once you see it. The rest of this article walks through reading the score report line by line, running a section-level gap analysis, matching your prep timeline to your score band, and handling National Merit for 11th graders.

What Your PSAT Score Actually Tells You (And What It Does Not)
Your PSAT/NMSQT score report has more information than most students use. The composite score, on a scale of 320 to 1520, sits at the top. Below it, two section scores: Reading and Writing (160 to 760) and Math (160 to 760). These two section scores are the numbers that matter most for SAT planning, because each one maps almost directly to the equivalent Digital SAT section (200 to 800 per section, per College Board).
Underneath the section scores you'll find subscores, each running 1 to 15. On the R&W side: Command of Evidence, Words in Context, Expression of Ideas, and Standard English Conventions. On the Math side: Heart of Algebra, Problem Solving and Data Analysis, and Passport to Advanced Math. Cross-test scores, running 10 to 40, appear next: Analysis in History/Social Studies and Analysis in Science. These subscores are where your prep plan actually gets built, because they tell you which skill areas are dragging your section score down.
Then come two percentile ranks. The nationally representative percentile compares you against all U.S. students in your grade whether they took the test or not. The user percentile compares you against actual PSAT takers, which is a tougher benchmark. A student with a 1200 composite might be around the 90th nationally representative percentile but closer to the 78th user percentile. Both are true. For SAT planning, the user percentile is the honest one.
Finally, College Board flags college readiness benchmarks on the report (verify the current benchmark thresholds against College Board documentation before acting, since they update periodically). A section score below benchmark isn't a verdict; it's a flag that foundational skills need work before speed and precision drills will pay off.
Before you interpret your score report, it helps to know exactly what the PSAT measures: two adaptive sections, Reading and Writing and Math, each scored 160 to 760, for a composite of 320 to 1520 (see our full breakdown of the Digital PSAT format and sections).
If you're unsure whether your composite is strong for your grade, our guide to what a good PSAT score looks like in 2026 gives percentile context for 8th through 11th graders.
Translating Your PSAT Score into a Projected SAT Range
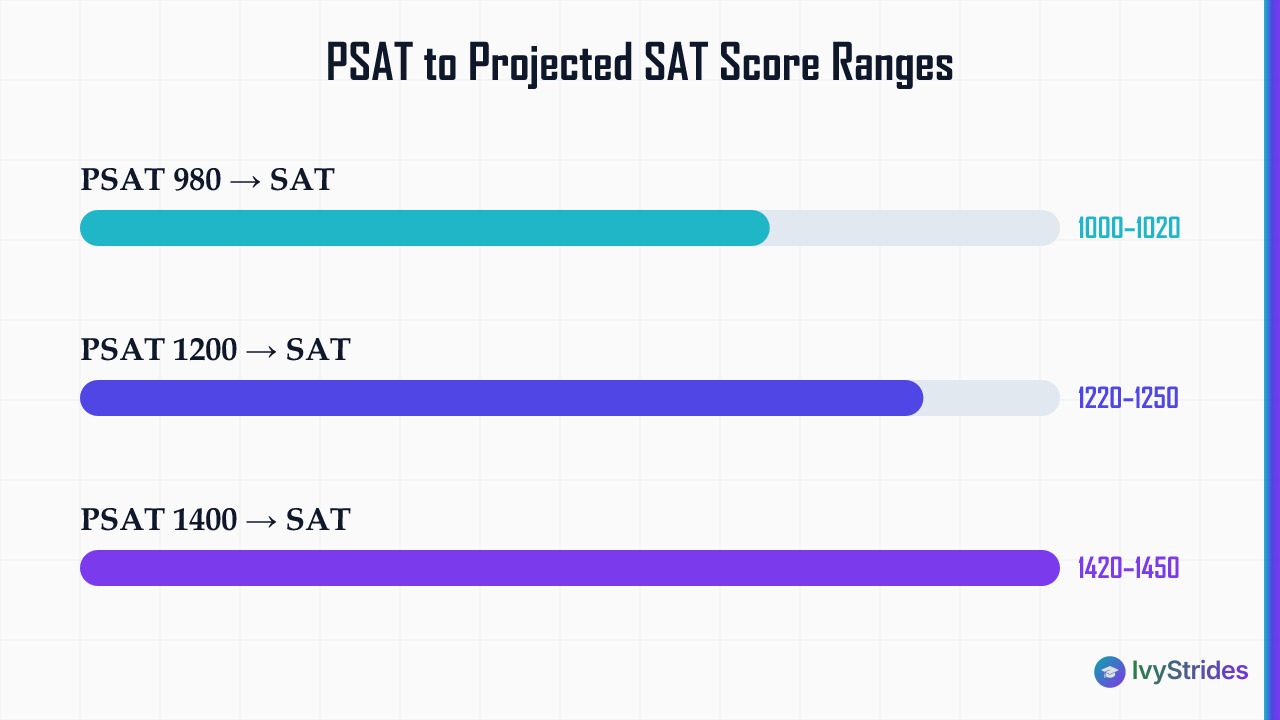
Here's the practical projection math. Because PSAT section scores top out at 760 and SAT section scores top out at 800, and because the SAT is calibrated to be modestly harder than the PSAT, most students land roughly 20 to 40 points above their PSAT composite when they take an SAT without prep. That's a projection, not a promise.
Three concrete examples using typical score-band patterns:
- A PSAT composite of 980 typically projects to an SAT in the 1000 to 1020 range on a first attempt.
- A PSAT composite of 1200 typically projects to an SAT in the 1220 to 1250 range.
- A PSAT composite of 1400 typically projects to an SAT in the 1420 to 1450 range.
Section by section, the same logic holds. A PSAT R&W of around 640 lines up with an SAT R&W in roughly the 660 to 680 zone. A PSAT Math of around 560 lines up with an SAT Math in roughly the 580 to 600 zone. Keep the two sections separate. Composite averages hide the section where your points are actually stuck.
Students often ask whether the SAT is harder than the PSAT. The short answer is yes, modestly, and that gap is exactly why your projected SAT score includes a small upward adjustment from your PSAT composite. Our full write-up on is the SAT harder than the PSAT unpacks the difficulty delta.
One important caveat: College Board does not publish an official PSAT-to-SAT conversion table. The 20 to 40 point projection above is an estimate based on scale alignment and typical cohort patterns, not a formula. Your actual SAT score will depend on prep hours, test-day conditions, and how comfortable you are with the Bluebook interface.
Note that the PSAT 8/9 (taken in 8th or 9th grade) scores on a 240 to 1440 scale, not 320 to 1520, so the projection math differs slightly; see our comparison of PSAT versions difference for the full breakdown.
How to Find the SAT Score You Actually Need for Your Target Colleges
An SAT goal set to a round number like "1500 because it sounds good" isn't a real goal. Real goals come from data your target colleges publish every year in their Common Data Set (CDS).
Here's the method. For each school on your list, search Google for "Common Data Set [University Name]" and open the most recent PDF the university publishes. Find Section C9. You'll see the 25th percentile, 50th percentile (median), and 75th percentile SAT composite and section scores for the most recent admitted class.
The strategic recommendation is to target the 75th percentile at your reach schools, not the median. A score at the 25th percentile means one out of four admitted students had a score at or below yours; that's not competitive positioning at a school where you're already stretching. A score at or above the 75th percentile makes your test score a lift on your application rather than a drag on it.
For a target list of roughly eight to twelve schools, take the highest 75th percentile on the list and use it as your ceiling goal. If your reach school shows a 75th percentile SAT of 1550 and your safety school shows 1300, you're prepping toward 1550. One number, one plan.
Test-optional caveat: per FairTest, many U.S. institutions remain test-optional as of the 2025 to 2026 cycle, but policies vary by school and by year. At most test-optional schools, submitting a strong score (at or above the 75th percentile) still measurably strengthens an application. Test-optional does not mean tests are irrelevant. It means schools have removed the requirement, not the advantage.
And admissions outcomes depend on the full application: transcript rigor, essays, activities, recommendations, and, where relevant, AP scores. Your SAT is one important input, not the whole story. For a wider view of how PSAT results feed into SAT success and admissions strategy, see our guide to PSAT results and SAT success benchmarks.
The Section Gap Analysis: Where Your SAT Points Are Actually Hiding
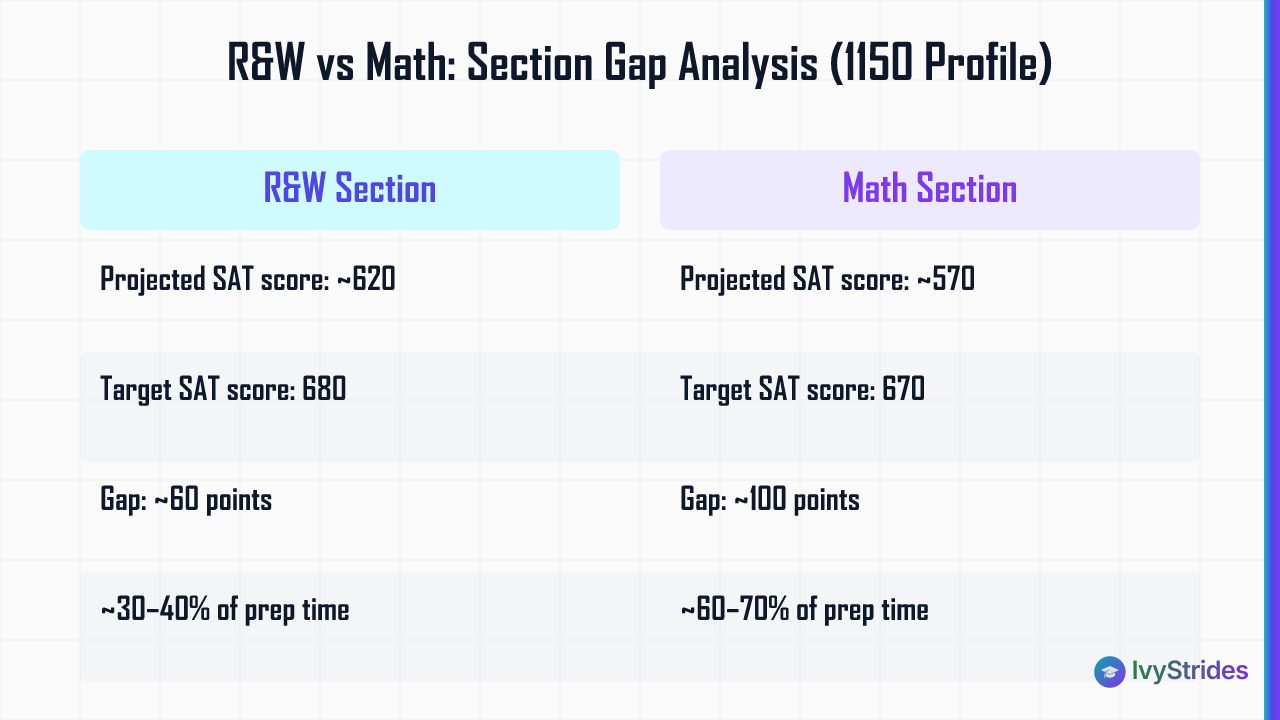
Now the real work. Composite goals are useful for admissions math, but composite goals don't tell you what to study on Tuesday night. Section gap analysis does.
Take the 1150 profile: PSAT composite 1150, R&W 600, Math 550. Projected SAT: roughly 1170 to 1190 without prep. SAT goal, based on the target school's 75th percentile: 1350. The composite gap is around 160 to 180 points. But those points aren't evenly distributed. The R&W section has room to move from around 620 (projected) to 680. The Math section has room to move from around 570 (projected) to 670. Math is the bigger gap. Math gets roughly 60 to 70 percent of prep time.
Here's the part most students miss. Subscore analysis inside the weaker section tells you which chapter of a prep book to open first. If a student with a Math section score of 550 has a Heart of Algebra subscore of 8 out of 15 (weak), a Problem Solving and Data Analysis of 11 (decent), and a Passport to Advanced Math of 9 (weak), then the first four weeks of Math prep target linear equations, systems, and inequalities, before touching quadratics or advanced functions. In our coaching, students who address their lowest subscore area first typically see faster composite gains than students who review all topics evenly.
The same subscore-first logic works on R&W. A Words in Context subscore of 7 means vocabulary-in-context question stems are leaking points every module. A Standard English Conventions subscore of 8 means grammar rules (subject-verb agreement, punctuation, modifier placement) are the fastest area to move.
This is why the section-specialist model matters. An R&W coach who has taught the Command of Evidence question type across hundreds of students knows how to close a 9 to 13 subscore gap. A Math coach who lives inside Passport to Advanced Math sees quadratic and function question patterns that a generalist tutor misses. One coach for both sections spreads too thin. Two specialists, one per section, matches the way the test actually assesses.
For section-level diagnostic practice, work through our PSAT practice tests to get subscore data on a fresh set of questions. Pair that with our sat mistake tracker to turn every missed question into a diagnostic data point.
Score-Band Playbooks: What to Do Based on Where You Are Right Now
Generic prep advice fails because the right plan for a 950 PSAT isn't the right plan for a 1380 PSAT. Three bands, three playbooks.
Band 1: PSAT 800 to 1050 (projected SAT roughly 820 to 1090). The gap to a competitive SAT score is large, often 200 points or more. In our coaching with students in the 800 to 1050 PSAT band, roughly 20-plus weeks of foundational skill work is the typical timeline for a 150 to 200-plus point SAT gain. Expect around six to eight hours of prep per week. Start with a full-length diagnostic. Prioritize foundational skill gaps in both sections before drilling test-specific tactics. Plan for a minimum of three full-length Bluebook practice tests spaced across the program. One-on-one coaching typically outperforms self-study at this band because the foundational gaps are wide enough that unguided prep tends to reinforce mistakes rather than fix them.
Band 2: PSAT 1060 to 1250 (projected SAT roughly 1080 to 1290). A medium gap, most commonly around 100 to 180 points to the goal. In our coaching with students in this band, a 12 to 16 week program with section-specialist coaching typically produces SAT improvements of 100 to 180 points. Expect roughly five to seven hours of prep per week. The strongest lever here is section-specialist work on the weaker section, informed by a subscore-level diagnostic. Minimum two full-length practice tests. Some students in this band succeed with a mix of self-study plus targeted coaching on the weak section only.
Band 3: PSAT 1260 to 1450 (projected SAT roughly 1280 to 1490). A small gap, usually around 50 to 100 points, but the hardest points to earn. Roughly eight to twelve weeks, three to five focused hours per week. The work at this band is precision on hard-difficulty question types, specifically the Module 2 questions on the adaptive Digital SAT. Per College Board's Bluebook documentation, your Module 1 performance determines whether Module 2 serves you the harder or easier item pool. High scorers face the harder pool, which means your practice diet needs to be heavy on hard-difficulty items, not medium ones.
In our coaching, students who plateau at Band 3 usually miss the same two or three hard-difficulty question archetypes across every practice test; fixing those specific archetypes is what separates a 1450 from a 1520.
For band-specific context on where a strong PSAT falls, see is a 1280 a good PSAT score. If your gap and timeline point toward structured coaching, our 1-on-1 SAT prep page walks through how section-specialist pairing works.
Building Your SAT Prep Timeline from Your PSAT Baseline
Work backward from a specific SAT test date. The SAT is offered roughly seven times per year in the U.S., with typical administrations in August, October, November, December, March, May, and June (verify the current 2025 to 2026 calendar on College Board). International dates vary. Pick your target SAT date first, then count weeks backward.
A Band 2 student aiming for the March SAT should start structured prep in late November or early December, giving roughly 12 to 16 weeks. A Band 1 student aiming for the same March date should have started in October at the latest, or should shift the goal to the May or June sitting.
Two schedule conflicts to plan around. First, AP exam season is the first two weeks of May (per the AP Program calendar). Students prepping simultaneously for SAT and multiple AP exams should reduce SAT prep hours in April and early May, then resume immediately after AP exams end if targeting a June SAT. Second, the 11th-grade PSAT/NMSQT falls in mid-October; if you're chasing National Merit, October is a PSAT-priority month, not an SAT-priority month.
Most students benefit from two to three SAT sittings across their timeline. The first sitting establishes a real SAT baseline (which often differs from the PSAT projection by roughly 20 to 60 points in either direction). The second sitting, after about 10 to 16 weeks of targeted prep, is usually where the largest jump lands. A third sitting is worthwhile if the second score is within roughly 50 to 80 points of the goal and you can name specific remaining weaknesses.
Between sittings, use the Bluebook app for full-length adaptive practice. College Board provides these tests at no cost; they are the only practice tests that match the live adaptive engine exactly. Supplement with additional item banks for section drills.
Your SAT goal score should be set with your college application deadlines in mind; our college application deadlines for 2026 to 27 article maps out when scores need to be submitted for Early Decision and Regular Decision rounds.
If you're reading this as a 9th or 10th grader, the timeline math is in your favor. Our grade-by-grade guide on PSAT strategy by grade shows how to use each year's PSAT as a stepping stone.
A Special Case: When Your PSAT Score Also Matters for National Merit
For 11th graders only, the PSAT/NMSQT feeds into the National Merit Scholarship Program, administered by the National Merit Scholarship Corporation (NMSC). The 8th and 9th grade PSAT 8/9, and the 10th grade PSAT 10, don't count for National Merit. Only the October 11th-grade sitting.
Your PSAT score report shows your Selection Index directly, on a scale of 48 to 228. Read the number off the report; don't try to recalculate it from your composite. The Selection Index is what NMSC uses for Commended and Semifinalist decisions.
Approximate national landscape (verify current NMSC figures before acting): roughly 1.5 million students take the PSAT/NMSQT annually. About 50,000 receive Commended Scholar recognition, with a national Commended cutoff typically around 208 to 212. Roughly 16,000 advance to Semifinalist status, with cutoffs varying by state, typically in the 208 to 223 range for the most recent cycles. High-cutoff states (California, Massachusetts, New Jersey, Texas, Virginia, and Washington, DC) sit at the top of that range. Lower-cutoff states sit closer to 208 to 212.
The strategic implication: if your Selection Index is within roughly 5 to 8 points of your state's typical cutoff, National Merit becomes its own prep priority, separate from SAT prep. The tests share content but reward different pacing and question-selection strategies, especially inside the PSAT's adaptive module structure.
If you're an 11th grader and your Selection Index is within roughly 5 to 8 points of your state's typical cutoff, your PSAT goal and your SAT goal may diverge; our guide to how to prep for National Merit walks through that separate track. For 10th-grade context on whether your current trajectory puts you in Semifinalist range, see good PSAT scores for 10th graders.
One hard caveat: NMSC cutoffs change every year and vary by state. Don't commit to a Selection Index target using last year's numbers without checking the current cycle's data with NMSC directly.
From PSAT Gap to SAT Plan: The Four-Step IvyStrides Methodology
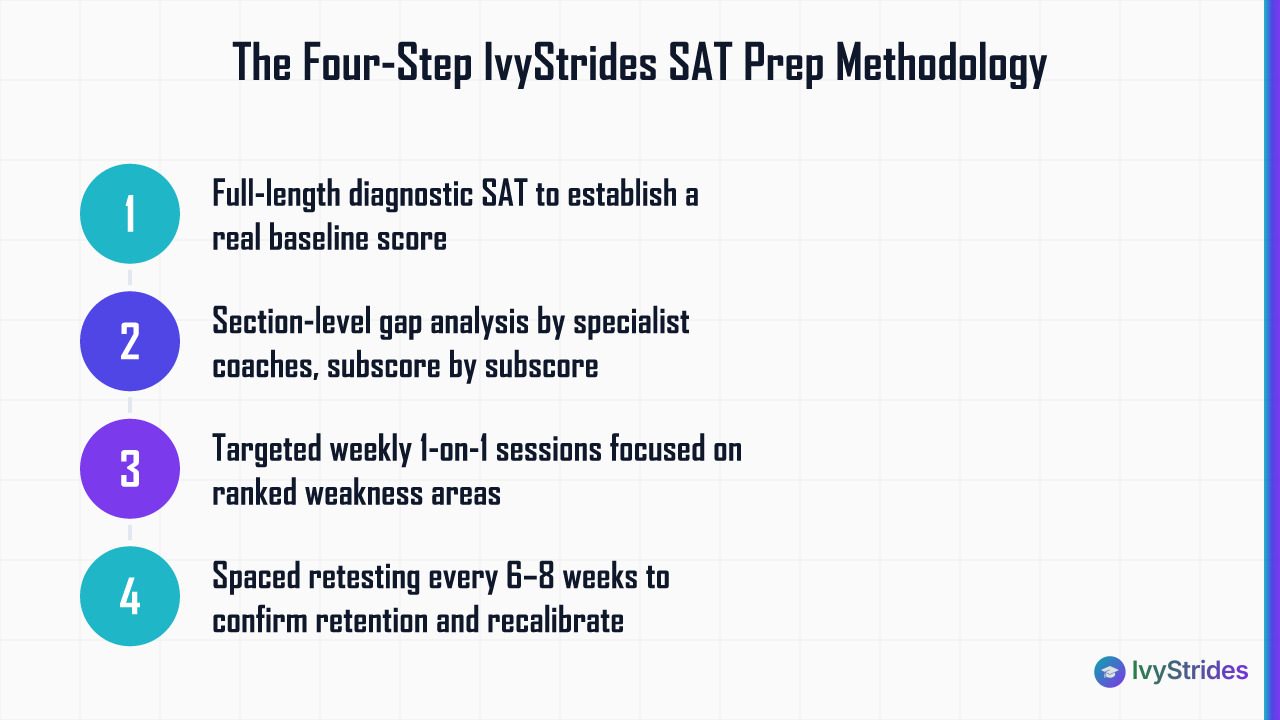
The projection math, gap analysis, and timeline planning above are the diagnostic layer. Here is how the actual prep work runs.
Step 1: Full-length diagnostic SAT. The PSAT projection is a starting estimate. A real SAT baseline comes from a full-length Digital SAT diagnostic, either through the Bluebook app or through our internal test packs. Roughly two hours, two adaptive sections, real conditions. This baseline sometimes lands about 20 to 60 points above or below the PSAT projection. Neither direction is a problem; the point is to plan from a real SAT number, not an estimated one.
Step 2: Section-level gap analysis. A section-specialist coach (an R&W specialist for R&W results, a Math specialist for Math results, not one generalist tutor) reviews the diagnostic subscore by subscore. Every missed question is categorized: skill gap, timing error, careless mistake, unfamiliar question type. The output is a ranked list of the three to five highest-use areas to attack first.
Step 3: Targeted weakness work. Weekly one-on-one sessions with the section specialist, focused on the ranked gap list. Between sessions, homework is problem sets on the specific subscore areas identified in Step 2, not shotgun review. This is where hyper-personalization beats group classes: the student never spends an hour reviewing a topic they already know, and never leaves a weakness unaddressed because "we didn't cover it in class."
Step 4: Spaced retesting. After roughly six to eight weeks, a second full-length practice test. New subscore data. Recalibrated plan. In our coaching, spaced retesting is what confirms retention. Skills students learn in isolation often erode without periodic full-test pressure.
Typical outcomes for students completing the program: roughly 100 to 180 points of SAT gain from the 1060 to 1250 PSAT band, and roughly 150 to 200-plus points from the 800 to 1050 band. These are typical ranges from our score-band data, not guarantees. Individual results depend on prep hours completed, consistency, and test-day performance.
You can meet the section coaches on our tutors page. When you're ready to build the plan, PSAT 1-on-1 prep is the direct next step.
FAQ
How accurate is the PSAT as a predictor of my SAT score?
The PSAT and SAT share the same design framework, so PSAT section scores are a reasonable starting estimate for SAT performance. But the projection isn't a guarantee. Students who prep systematically between the two tests typically score meaningfully higher than the raw projection suggests, while students who do zero prep tend to land close to the projection or slightly below. Use the PSAT as a floor, not a ceiling.
I got a 1170 on the PSAT and a 1300 on the SAT. Why is there such a big gap?
A gap larger than roughly 40 to 50 points between PSAT composite and SAT composite usually reflects one of three things: structured prep between the two tests, a stronger performance on one section on test day, or better familiarity with the Bluebook interface the second time through. A 130-point jump from PSAT 1170 to SAT 1300 is consistent with what we see in our coaching when students complete about 10 to 14 weeks of targeted section work before the SAT date.
How many times should I take the SAT if I want to improve from my PSAT baseline?
Most students benefit from two to three SAT attempts. The first attempt establishes a real SAT baseline, which sometimes differs from the PSAT projection. The second attempt, after roughly 10 to 16 weeks of targeted prep, is typically where the largest score jump appears. A third attempt is worthwhile when the second score sits within roughly 50 to 80 points of the goal and specific remaining weaknesses are identified.
Does my PSAT score matter for college admissions directly?
No. Colleges don't receive or consider your PSAT score. The PSAT matters for two things: qualifying for National Merit recognition (11th-grade sitting only) and serving as your personal diagnostic baseline for SAT prep. The SAT score you submit is the number that reaches admissions offices.
What if my PSAT score is already above my SAT target range?
If your PSAT composite plus the typical 20 to 40 point projection already clears the 75th percentile at your reach schools, prep focus shifts from gap-closing to score protection and consistency. In our coaching, students in this position benefit most from two to three full-length timed practice tests to confirm the score holds under real test conditions, plus precision work on the hard-difficulty Module 2 question types that push a 1450 toward 1520-plus.
Is free PSAT prep enough to make National Merit?
For students within roughly 5 to 8 Selection Index points of their state's cutoff, free resources alone are rarely sufficient because the margin is too narrow for unguided prep to close reliably. Students further from the cutoff, either well above or well below, can often use free resources productively. The specific answer depends on state cutoff, starting Selection Index, and time remaining before the October PSAT/NMSQT.
Your Next Step
You have a PSAT score, a projected SAT range, a section-level gap, and a rough timeline. The next question is whether the plan gets built and executed. That's where structured coaching earns its keep.

Award-winning author (South Asian Book Award) and graduate of BITS Pilani and UCLA Luskin School of Public Affairs. Brings a published writer's eye to Common App essays and grammatical precision to SAT and ACT R&W instruction.