
Command of Evidence SAT Practice: 12 Questions With Answers
On this page
- What Command of Evidence Questions Are on the Digital SAT
- Why Command of Evidence Questions Matter for Your SAT Score
- The Method: How to Approach Every Command of Evidence Question
- Why Students Keep Missing These Questions Even After Reading Carefully
- Still Missing Command of Evidence Questions? Let's Find Out Why.
- Easy Command of Evidence Practice Questions (Questions 1–4)
- Medium Command of Evidence Practice Questions (Questions 5–8)
- Hard Command of Evidence Practice Questions (Questions 9–12)
- Score Your Practice Set: What Your Results Mean
- What to Work On After These Practice Questions
- FAQ
- How many command of evidence questions are on the Digital SAT?
- What is the difference between textual and quantitative command of evidence on the SAT?
- Why do I keep getting command of evidence questions wrong even when I read the passage carefully?
- Do command of evidence questions appear in both Module 1 and Module 2 of the Digital SAT?
- Is command of evidence on the PSAT the same as on the SAT?
- How do I practice command of evidence questions beyond this set?
- Ready to Turn Command of Evidence Into a Reliable Score Source?
Command of evidence questions on the Digital SAT ask you to find the piece of text or data that best supports a specific claim. They come in two subtypes: textual (select the quote that backs a stated conclusion) and quantitative (read a graph or table to find the data point that completes a claim). These questions appear in both Module 1 and Module 2 of the Reading and Writing section, and they're one of the highest-use scoring areas on the exam.
If you keep losing points on "best evidence" questions, it's almost never a reading speed problem. It's a method problem.
The 12 practice questions below are organized by subtype and difficulty, with method-tagged explanations so you can see exactly where your reasoning is breaking down. Work through every question, then score yourself against the rubric near the end.
What Command of Evidence Questions Are on the Digital SAT
Command of evidence sits inside the Information and Ideas domain on the Digital SAT Reading and Writing section. Per the College Board test specification, Information and Ideas accounts for roughly 26 to 28 percent of R&W questions, which makes it one of the highest-use scoring areas on the exam (College Board).
Two subtypes exist, and you need to recognize them instantly.
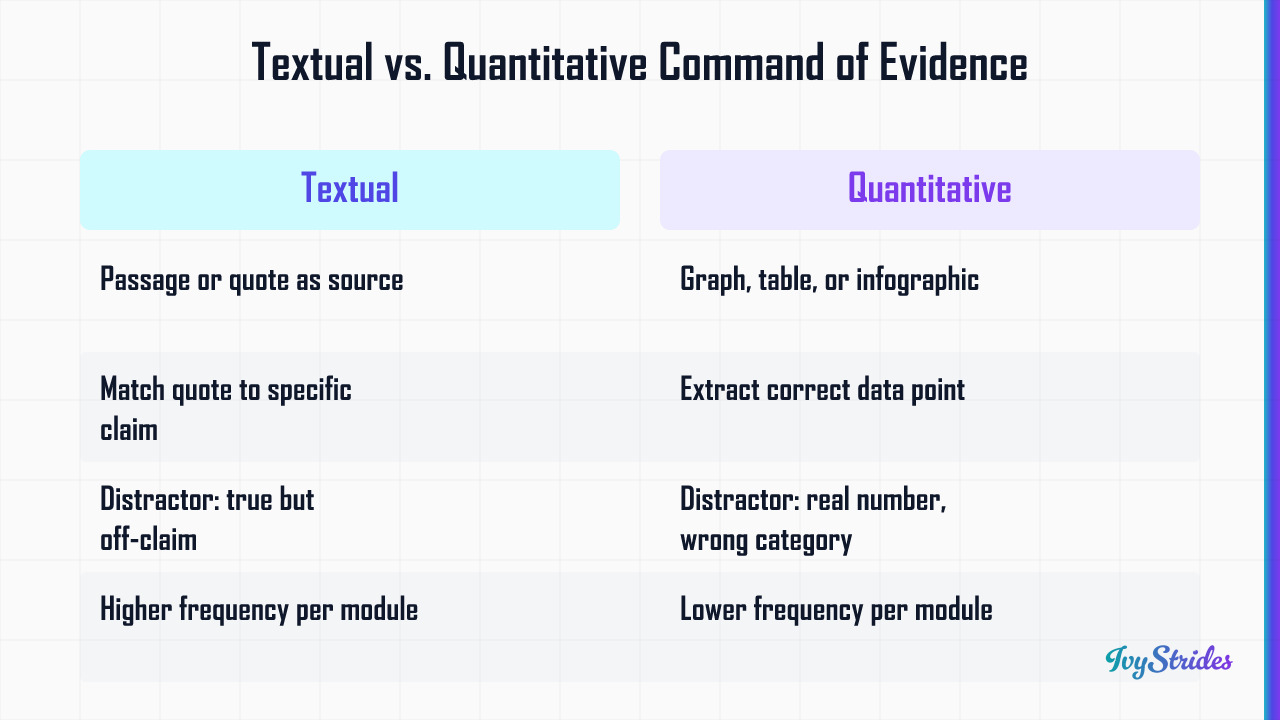
Textual command of evidence gives you a short passage and asks which quotation, sentence, or finding best supports a stated claim or hypothesis. The correct evidence option matches the specific claim. Distractors are often true statements pulled from the passage that support a different idea. The subtype appears in both Module 1 and Module 2, and the difficulty range runs from direct retrieval (easy) to plausible-distractor sorting (medium) to qualifier-sensitive scope matching (hard).
Quantitative command of evidence gives you a written claim plus a graph, table, or infographic. You select the data point that completes or challenges the claim. This subtype tests data literacy, not arithmetic. It appears less frequently than the textual subtype but carries high value for students who misread axes or units. Most errors come from misreading an axis label, grabbing the wrong row, or matching the wrong time period.
The R&W section has two adaptive modules. 27 questions each. 32 minutes per module. The score range is 200 to 800. Module 2 difficulty is routed by Module 1 performance (College Board).
In our coaching, students see roughly 3 to 5 command of evidence questions per module, split unevenly between textual and quantitative depending on the form. Exact counts vary because College Board doesn't publish per-form breakdowns.
That distribution matters more than it sounds. Miss 4 of these per test and that's a chunk of your R&W score scale and percentile placement sitting on the table.
Why Command of Evidence Questions Matter for Your SAT Score
The Digital SAT routes you to a harder or easier Module 2 based on your Module 1 accuracy. Getting command of evidence questions right in Module 1 is one of the clearest paths to unlocking the higher-difficulty Module 2 where the top R&W scores live. For the routing mechanics in full, see how the Digital SAT adaptive modules work.
Here's the part most students miss. On the Digital SAT R&W scale of 200 to 800, moving from roughly 600 to 700 often comes down to consistent accuracy on Information and Ideas questions, including command of evidence, rather than grammar or vocabulary alone.
In our coaching with students in the 580 to 650 R&W band, command of evidence errors sit in the top three question-type contributors to score stagnation. Students who break through to 700+ usually show measurable accuracy gains in Information and Ideas first. Standard English Conventions tends to respond fastest to rote rules. Command of evidence rewards method.
On the quantitative side, the errors are almost mechanical. A student misreads an axis label. Grabs the wrong row. Picks a number tied to the wrong year. The reasoning was fine. The data extraction wasn't.
The Method: How to Approach Every Command of Evidence Question
Four steps. Apply them to every command of evidence question, regardless of subtype or difficulty.
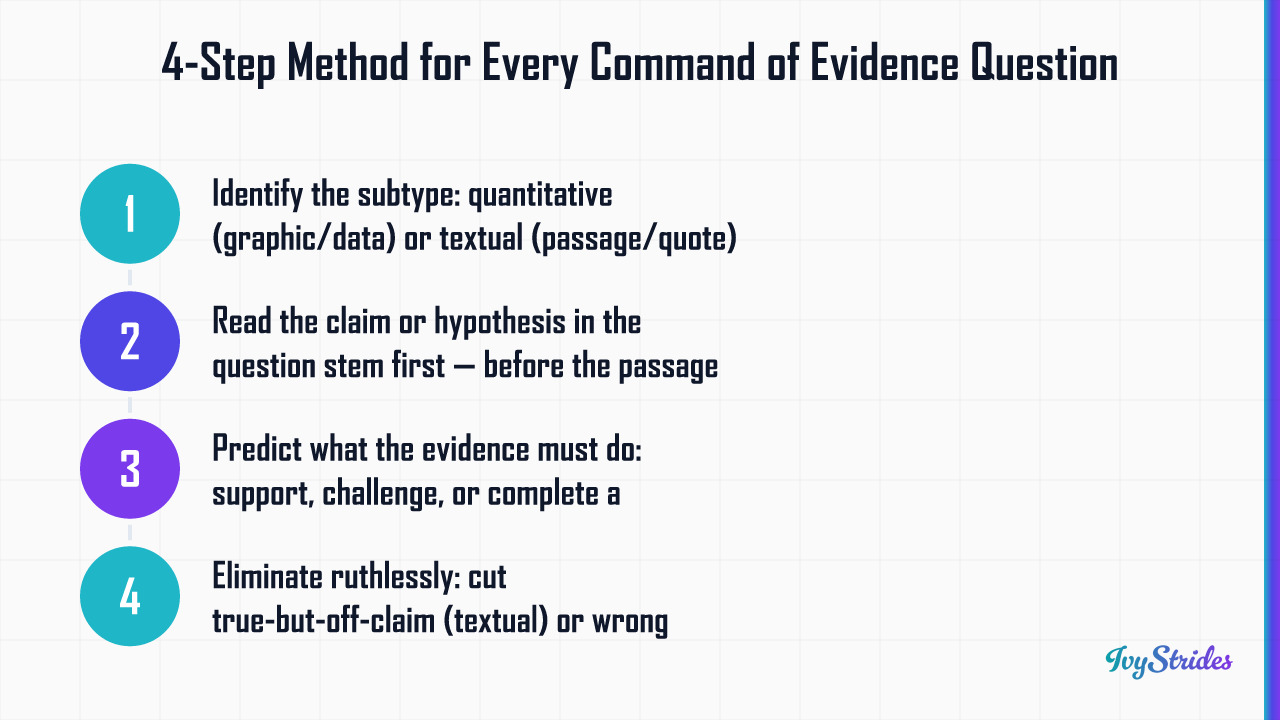
Step 1: Identify the subtype before you read anything else. If the question stem references a graphic, table, chart, or "the data," it's quantitative. If it references a passage, study, or quote, it's textual. Two seconds. Changes how you read.
Step 2: Read the claim or hypothesis in the question stem first. Not the passage. Not the graph. The claim. The stem tells you exactly what the evidence has to do. Without that framing, every answer choice will look plausible.
Step 3: Predict what the evidence must do. Support the claim? Challenge it? Complete a comparison? Hold the prediction in your head before reading the options.
Step 4: Eliminate ruthlessly. For textual, throw out options that are true but address a different aspect of the topic. For quantitative, throw out options that cite real numbers from the graphic but reference the wrong category, unit, or time period.
In our coaching, students who switch to a claim-first method reduce command of evidence errors by roughly half within 2 to 3 targeted practice sessions. That's the fastest-moving lever we see on R&W aside from punctuation rules.
Why Students Keep Missing These Questions Even After Reading Carefully
You read the passage. Twice. You understood it. You still got the question wrong. Sound familiar?
Two error patterns explain almost every miss.
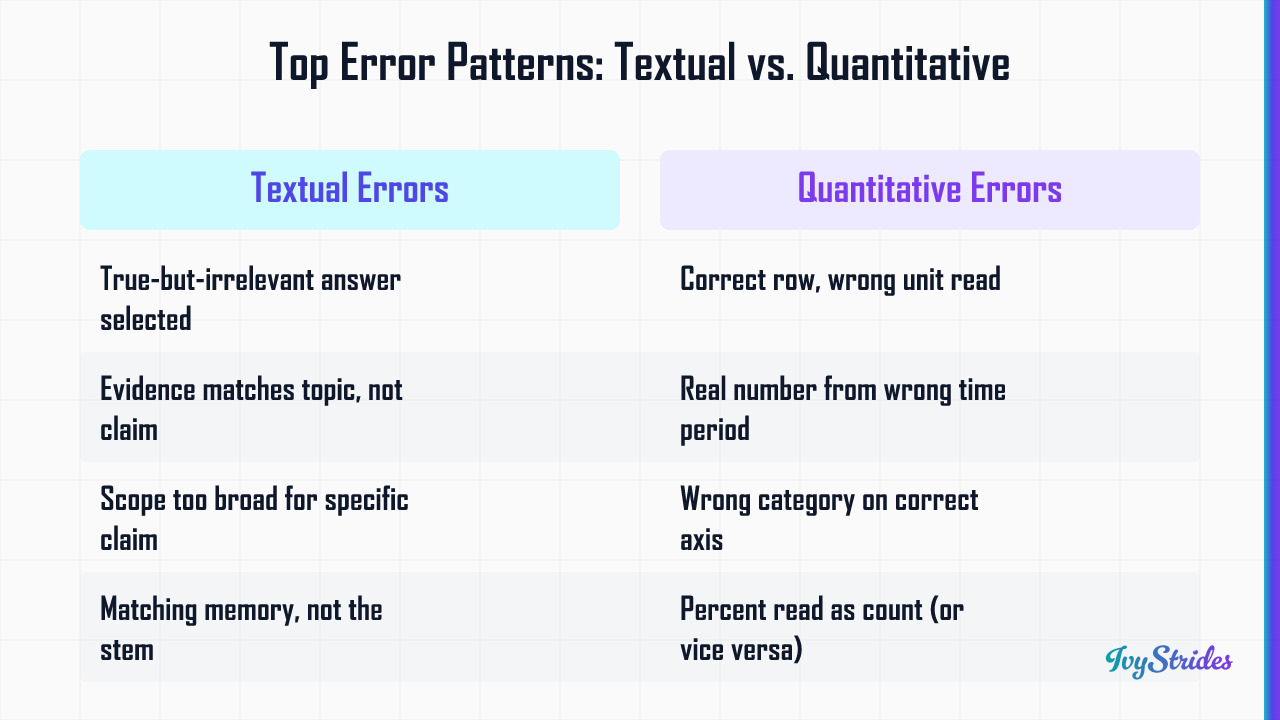
The true-but-irrelevant trap. The answer is accurate. It comes straight from the passage. It just supports a different claim than the one in the question stem. This is the single most common wrong-answer pattern in textual command of evidence. Test writers build distractors specifically to catch students who finished the passage and are now matching answer choices to "things I remember from the text" rather than to the specific claim.
Scope mismatch. The evidence is true and on-topic, but too broad. The claim says something specific. The evidence supports the general topic without addressing the specific condition. A claim about "first-year students" needs evidence about first-year students, not about students overall.
On quantitative questions, the parallel error is reading the correct row or bar but misidentifying the unit or time period. The chart says percent. You read it as count. The data covers 2018 to 2022. You grab the 2015 baseline. Real number. Wrong number.
In our coaching, students scoring below 650 on R&W miss command of evidence questions at roughly twice the rate of students scoring above 700, even when both groups report "reading the passage carefully." Careful reading isn't the bottleneck. Method is.
A junior we worked with last spring came in at 620 R&W and was consistently picking true-but-irrelevant answers on textual questions. After two sessions focused on claim-first reading, her accuracy on command of evidence practice sets moved from 50% to 80%. Same student. Same reading speed. Different sequence.
For a deeper diagnostic on why your SAT reading score is not improving despite practice volume, we cover the full breakdown in that piece.
Still Missing Command of Evidence Questions? Let's Find Out Why.
In a free 15-minute strategy call, an IvyStrides R&W specialist will review your current score band, identify your specific error pattern on Information and Ideas questions, and recommend the right next step, whether that's a targeted practice plan, a Test Pack, or 1-on-1 coaching. Students and parents both welcome.
Easy Command of Evidence Practice Questions (Questions 1–4)
These mirror the lower-difficulty items you'd see in Digital SAT Module 1. All passage excerpts and data are original; nothing is reproduced from College Board or any third-party source.
Question 1 (Textual, Easy)
Passage excerpt: Researchers studying the migratory patterns of monarch butterflies in eastern North America found that adult monarchs born in late summer travel significantly farther during their southbound migration than those born earlier in the year. The late-summer generation, sometimes called the "super generation," can travel up to 3,000 miles to overwintering sites in central Mexico, while monarchs born in spring and early summer rarely travel more than 500 miles in their entire lifespan.
Question: Which finding from the passage most directly supports the claim that late-summer monarchs are biologically distinct from those born earlier in the year?
A) Monarch butterflies migrate to central Mexico.
B) Late-summer monarchs travel up to 3,000 miles, while earlier generations rarely travel more than 500 miles.
C) Researchers studied monarchs in eastern North America.
D) Spring monarchs have a shorter lifespan than late-summer monarchs.
Correct answer: B. Direct retrieval. The claim is about distinction between generations, and B names the specific quantitative gap. A is wrong scope (true but addresses general migration, not the distinction). C is true but irrelevant (study location). D is wrong data point (the passage doesn't compare lifespans directly).
Question 2 (Quantitative, Easy)
Description of graphic: A simple bar chart titled "Average Monthly Rainfall, City X, 2023" shows: January 2.1 inches, April 3.4 inches, July 5.8 inches, October 3.0 inches.
Question: A student claims that July received more than twice the rainfall of January in City X in 2023. Which choice best supports this claim?
A) October received 3.0 inches.
B) January received 2.1 inches and July received 5.8 inches.
C) April received 3.4 inches.
D) July is typically the wettest month in City X.
Correct answer: B. Direct evidence retrieval. The claim compares January and July; B cites both. A is wrong data point (October isn't in the claim). C is wrong data point (April isn't in the claim). D is true but irrelevant (the claim isn't about typical patterns; it's about 2023 specifically, and D adds no number).
Question 3 (Textual, Easy)
Passage excerpt: The invention of the cotton gin in 1793 by Eli Whitney dramatically increased the efficiency of cotton processing. Before the gin, a single worker could clean about one pound of cotton per day. After the gin, that same worker could clean approximately 50 pounds per day.
Question: Which detail from the passage most directly supports the claim that the cotton gin substantially increased worker output?
A) The cotton gin was invented in 1793.
B) Eli Whitney invented the cotton gin.
C) A single worker could clean about 50 pounds per day after the gin, compared to one pound before.
D) Cotton processing was inefficient before 1793.
Correct answer: C. Direct comparison of output. A and B are true but irrelevant (they identify the invention, not the output change). D is wrong scope (it characterizes the pre-gin era but doesn't quantify the increase).
Question 4 (Quantitative, Easy)
Description of graphic: A table titled "Library Book Checkouts, City Library, 2022" lists: Fiction 12,400; Non-fiction 8,200; Children's 15,600; Reference 1,100.
Question: A librarian claims that Children's books were the most-checked-out category at the City Library in 2022. Which choice best supports this claim?
A) Fiction was 12,400 and Children's was 15,600.
B) Reference was the least-checked-out category.
C) Non-fiction checkouts totaled 8,200.
D) Children's books totaled 15,600, more than any other category.
Correct answer: D. D directly addresses the "most" claim by stating Children's exceeded all other categories. A is partial (compares to Fiction only, not all categories). B is true but irrelevant (it's about Reference, not the "most" claim). C is wrong data point.
Medium Command of Evidence Practice Questions (Questions 5–8)
Medium-difficulty items appear in both Module 1 and the easier Module 2 routing. Distractors here are more plausible. Apply the claim-first method.
Question 5 (Textual, Medium)
Passage excerpt: A 2021 study of urban tree canopies in five US cities found that neighborhoods with greater tree cover experienced summer afternoon temperatures roughly 4 to 7 degrees Fahrenheit cooler than nearby neighborhoods with sparse tree cover. The researchers also noted that residents of tree-dense neighborhoods reported higher satisfaction with outdoor spaces, though the study did not measure direct health outcomes.
Question: Which finding from the passage most directly supports the hypothesis that urban tree canopies reduce summer heat exposure?
A) Residents of tree-dense neighborhoods reported higher satisfaction with outdoor spaces.
B) Tree-dense neighborhoods were 4 to 7 degrees Fahrenheit cooler than sparse-canopy neighborhoods on summer afternoons.
C) The study covered five US cities.
D) The researchers did not measure direct health outcomes.
Correct answer: B. The hypothesis is specifically about heat exposure reduction. B provides the temperature differential. A is the true-but-irrelevant trap (satisfaction is a real finding but addresses a different claim). C is true but irrelevant (study scope). D is true but irrelevant (it limits what was studied but doesn't support the heat-reduction hypothesis).
Question 6 (Quantitative, Medium)
Description of graphic: A table titled "Average Hours of Sleep by Age Group, 2022 Survey" lists: Ages 14 to 17, 7.1 hours weekdays / 9.2 hours weekends; Ages 18 to 25, 6.4 hours weekdays / 8.5 hours weekends; Ages 26 to 40, 6.8 hours weekdays / 7.9 hours weekends.
Question: A researcher claims that the gap between weekday and weekend sleep among ages 14 to 17 is larger than the gap among ages 26 to 40. Which choice best supports the claim?
A) Ages 14 to 17 sleep 9.2 hours on weekends, more than any other group.
B) Ages 18 to 25 sleep the fewest hours on weekdays at 6.4.
C) Ages 14 to 17 show a 2.1-hour gap between weekday (7.1) and weekend (9.2), compared with a 1.1-hour gap for ages 26 to 40 (6.8 to 7.9).
D) Ages 26 to 40 sleep 7.9 hours on weekends.
Correct answer: C. The claim is about the gap, not absolute hours. C calculates and compares both gaps. A is true but irrelevant (highest weekend hours is a different claim). B is true but irrelevant (lowest weekday hours, not the gap). D is wrong data point.
Question 7 (Textual, Medium)
Passage excerpt: In her 2019 analysis of remote work patterns, economist Dr. Lena Park argued that the productivity effects of working from home depend heavily on job type. For tasks involving independent, focused work, remote employees produced output at rates 13% higher than in-office counterparts. For tasks requiring frequent real-time collaboration, however, remote workers showed a 9% productivity decline.
Question: Which finding from the passage most directly supports Dr. Park's claim that remote work productivity depends on job type?
A) Dr. Park published her analysis in 2019.
B) Remote workers showed a 9% productivity decline on collaborative tasks.
C) Independent-work productivity rose 13% remotely while collaborative-task productivity fell 9%.
D) Working from home has become more common since 2019.
Correct answer: C. The claim is about job-type dependence. C shows the contrast across two job types. B is the true-but-irrelevant trap: accurate, but supports only half the claim (the decline), not the dependence pattern. A is true but irrelevant. D isn't in the passage.
Question 8 (Quantitative, Medium)
Description of graphic: A bar chart titled "Percent of US Adults Reporting Daily Exercise, by Region, 2023" shows: Northeast 28%, South 22%, Midwest 26%, West 34%.
Question: A public health official claims that the gap between the highest- and lowest-exercising regions exceeds 10 percentage points. Which choice best supports the claim?
A) The West reported 34% daily exercise.
B) The South reported the lowest rate at 22%.
C) The West (34%) and the South (22%) differ by 12 percentage points.
D) The Northeast and Midwest both reported rates above 25%.
Correct answer: C. The claim requires comparing the highest and lowest regions and showing the difference exceeds 10 points. C does both. A and B are partial (each names one endpoint). D is true but irrelevant (middle regions, not the gap).
Hard Command of Evidence Practice Questions (Questions 9–12)
These mirror the hardest items in the harder Module 2 routing, the territory where 700+ R&W scores live. The claims contain qualifiers. The distractors include answers that would be correct if the qualifier weren't there. For deeper work on the quantitative side, see SAT data analysis strategies for charts and graphs.
Question 9 (Textual, Hard)
Passage excerpt: A multi-year study of community gardens in Detroit, Cleveland, and Pittsburgh examined the social effects of shared gardening spaces. Researchers found that, across all three cities, garden participants reported a 22% increase in neighborhood social ties after one year of participation. However, the increase was significantly larger, roughly 38%, specifically among participants who lived within a two-block radius of the garden they tended. Participants who traveled longer distances to their gardens showed gains closer to the overall 22% average.
Question: Which finding from the passage most directly supports the claim that proximity to a community garden, specifically living within walking distance, amplifies its social benefits?
A) Garden participants across all three cities reported a 22% increase in social ties.
B) Participants who lived within a two-block radius reported a 38% increase, compared with 22% for the broader sample.
C) The study covered Detroit, Cleveland, and Pittsburgh.
D) Participants who traveled longer distances showed gains near the 22% average.
Correct answer: B. The qualifier is "specifically living within walking distance," and B is the only option that ties the larger gain to that specific subgroup. A is the trap most students fall into: the 22% figure is real, prominent, and from the passage, but it speaks to the overall sample, not the proximity subgroup. C is true but irrelevant. D is close: it confirms the inverse pattern (distance reduces the effect) but doesn't directly support the amplification claim; it merely fails to contradict it.
Question 10 (Quantitative, Hard)
Description of graphic: A table titled "Annual Rainfall and Wheat Yield, Farm Region Y, 2018 to 2023" lists: 2018, 24 inches rainfall, 42 bushels/acre; 2019, 30 inches, 48 bushels; 2020, 18 inches, 35 bushels; 2021, 22 inches, 40 bushels; 2022, 28 inches, 51 bushels; 2023, 26 inches, 44 bushels.
Question: An agricultural researcher claims that, in Region Y, wheat yields were highest in the year with the second-highest rainfall, not the highest. Which choice best supports the claim?
A) 2019 had the highest rainfall at 30 inches and a yield of 48 bushels/acre.
B) 2022 had the second-highest rainfall at 28 inches and the highest yield at 51 bushels/acre.
C) 2020 had the lowest rainfall and the lowest yield.
D) Rainfall and yield generally rise together across the six years.
Correct answer: B. The claim has two qualifiers, highest yield and second-highest rainfall. B addresses both. A is the trap: it cites the highest-rainfall year, which a fast reader assumes is also the highest yield, but the claim explicitly says it isn't. C is true but irrelevant. D is wrong scope (overall trend, not the specific second-highest year).
Question 11 (Textual, Hard)
Passage excerpt: In a 2022 analysis of nutrition labeling laws, public health researcher Dr. Amir Hossain examined three policy interventions: front-of-package warning labels, calorie disclosures on menus, and ingredient-list reformatting. He concluded that warning labels produced measurable reductions in consumer purchase of high-sodium products, with average purchase declines of 11%. Calorie disclosures produced smaller effects on purchasing behavior, around 3%, but were associated with increased consumer awareness of nutritional content. Ingredient reformatting had no measurable effect on either purchasing or awareness.
Question: Which finding from the passage most directly supports the claim that the strongest tool for changing consumer purchasing behavior, as opposed to awareness, is front-of-package warning labels?
A) Calorie disclosures increased consumer awareness of nutritional content.
B) Front-of-package warning labels reduced high-sodium product purchases by 11%, compared with 3% for calorie disclosures and no effect for ingredient reformatting.
C) Ingredient reformatting had no measurable effect on purchasing or awareness.
D) Dr. Hossain's 2022 analysis examined three policy interventions.
Correct answer: B. The qualifier is "purchasing behavior, as opposed to awareness." B compares all three interventions on the purchasing dimension specifically. A is the trap: a real finding, but it addresses awareness, which the claim explicitly sets aside. C is partial (confirms one data point but doesn't establish the full comparison). D is true but irrelevant.
Question 12 (Quantitative, Hard)
Description of graphic: A line graph titled "Monthly Active Users (in millions), App A vs. App B, January to December 2023" shows: App A rises steadily from 12M in January to 28M in December. App B rises from 8M in January to 22M in July, then declines to 18M in December. Both apps show their largest single-month gain in March (App A: +3M; App B: +4M).
Question: A market analyst claims that, despite App B's stronger early growth, App A finished 2023 with a larger user base specifically because App A sustained growth throughout the second half of the year. Which choice best supports the claim?
A) App B grew by 4 million users in March, the largest single-month gain of either app.
B) App A grew steadily from 12M in January to 28M in December, while App B peaked at 22M in July and declined to 18M by December.
C) Both apps showed their largest gains in March.
D) App A ended the year with 28M users.
Correct answer: B. The claim has a specific structural argument: App A won because it sustained second-half growth while App B declined. B captures both halves of the comparison. A is the trap: a real, striking number that supports App B's early strength, but the claim is about sustained growth, not single-month peaks. C is true but irrelevant. D is partial (confirms App A's endpoint but ignores the sustained-vs-declining comparison the claim depends on).
Score Your Practice Set: What Your Results Mean
Count your correct answers, then map your score to the band below. These mappings reflect typical patterns from our coaching practice; they're a directional indicator, not a precise score predictor. For a more accurate estimate, take a full-length official practice test through Bluebook (College Board).
0 to 4 correct (mostly easy errors): You're likely scoring below 600 on R&W. Priority is mastering the claim-first method on easy and medium questions before attempting hard ones. Practice without time pressure first. Speed comes after the method clicks.
5 to 8 correct (easy correct, medium mixed): You're likely in the 600 to 680 R&W range. The highest-use next step is targeted practice on medium-difficulty command of evidence, specifically the true-but-irrelevant trap and scope-matching. This is the band where method work pays off fastest.
9 to 12 correct (medium and hard correct): You're likely in the 680 to 750+ R&W range. Focus shifts from accuracy on this question type to pacing and consistency across all Information and Ideas question types. In our coaching, students who consistently score 9 or more on hard command of evidence sets are typically ready to move attention to Craft and Structure, the next R&W lever.
For a fuller picture of your prep arc, see our SAT study plan and prep timeline and the SAT study guide 2026.
What to Work On After These Practice Questions
Once you have command of evidence under control, the other high-frequency R&W category to audit is Standard English Conventions on the SAT, punctuation and grammar rules that appear in roughly 20% of R&W questions and respond quickly to targeted practice.
Building a broader SAT study plan? Command of evidence is one of the first R&W question types to isolate in targeted practice because it appears across both modules and responds well to a repeatable method.
A full-length practice test is your next diagnostic step. Isolated question sets like this one tell you about a specific skill. A full-length test tells you about pacing, fatigue, and which Module 2 you'd actually route into. IvyStrides Test Packs include full-length Digital SAT practice tests with score-band breakdowns by question type, which is what you need to see your real ceiling.
If errors persist across both subtypes after targeted practice, that's the signal for 1-on-1 R&W coaching. A section-specialist coach runs a diagnostic, identifies your exact error pattern, and builds a question-type-specific plan, not a generic curriculum. For students completing our program in the 550 to 650 R&W band, score movement of 60 to 100 points is typical.
One caveat worth holding onto. SAT scores are one component of college admissions. Test-optional policies vary by school and by year, and you should check current policy at each of your target schools through their admissions site and the FairTest tracker before deciding how much weight to give the SAT in your overall application strategy. A strong R&W score still helps almost everywhere it's reported. It just isn't the whole story.
FAQ
How many command of evidence questions are on the Digital SAT?
The Digital SAT doesn't publish exact question-type counts per test form. College Board's test specification indicates that Information and Ideas questions, which include command of evidence, account for approximately 26 to 28 percent of the 54 R&W questions across both modules (College Board). In practice, most students see roughly 3 to 5 command of evidence questions per module, split between textual and quantitative subtypes. Exact count varies by form.
What is the difference between textual and quantitative command of evidence on the SAT?
Textual command of evidence asks you to select a quotation or sentence from a passage that best supports a stated claim. Quantitative command of evidence asks you to read a graph, table, or chart and identify the data point that completes or challenges a written claim. The core skill is the same, matching evidence to a specific claim, but the source differs. You can identify the subtype instantly: if the question references a graphic, it's quantitative.
Why do I keep getting command of evidence questions wrong even when I read the passage carefully?
The most common reason is selecting an answer that's true and from the passage but supports a different claim than the one in the question stem. Careful reading of the passage isn't enough; you need to read the claim in the question stem first, predict what the evidence must do, and then evaluate each option against that specific claim. In our coaching, students who switch to a claim-first method see a measurable reduction in command of evidence errors within a few targeted practice sessions.
Do command of evidence questions appear in both Module 1 and Module 2 of the Digital SAT?
Yes. Command of evidence questions appear in both modules of the Digital SAT R&W section. In the harder Module 2 routing, the questions tend to involve more precise qualifier matching and more plausible distractors, which is why your accuracy in Module 1 matters for your overall score ceiling.
Is command of evidence on the PSAT the same as on the SAT?
The PSAT/NMSQT uses the same question-type framework as the Digital SAT, including command of evidence in both textual and quantitative subtypes (College Board). PSAT versions tend to skew toward the easy-to-medium difficulty range compared with the hardest SAT Module 2 items. Practicing command of evidence for the SAT will directly strengthen your PSAT performance as well.
How do I practice command of evidence questions beyond this set?
College Board's official Digital SAT practice tests, available through Bluebook and the College Board website, are the highest-fidelity source for additional practice. For students who want a structured full-length practice experience with score-band analysis, IvyStrides Test Packs provide complete Digital SAT practice tests with detailed breakdowns by question type.
You now know what command of evidence questions are testing, the method that works on both subtypes, and where your accuracy currently sits. The next move is the one that closes the gap between practice score and test-day score.
Ready to Turn Command of Evidence Into a Reliable Score Source?
Book a free 15-minute SAT strategy call. We'll look at your current R&W score, map your question-type accuracy, and build a diagnostic-driven plan to move your score. Students and parents both welcome.

Award-winning author (South Asian Book Award) and graduate of BITS Pilani and UCLA Luskin School of Public Affairs. Brings a published writer's eye to Common App essays and grammatical precision to SAT and ACT R&W instruction.